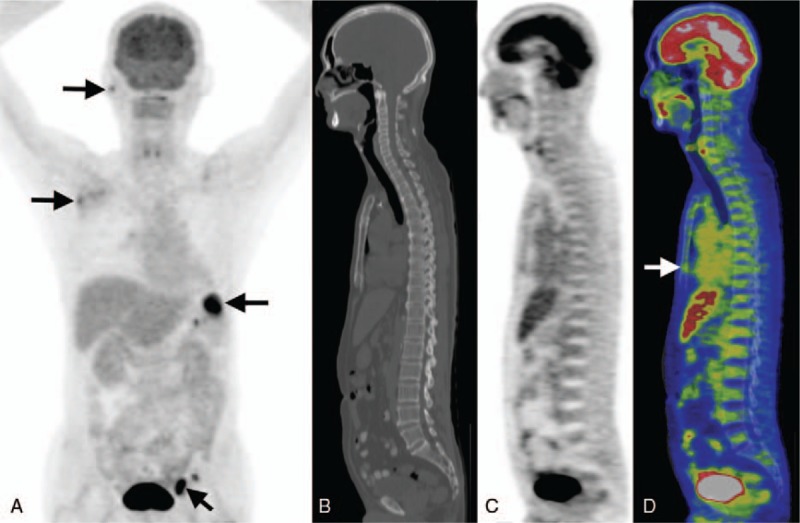
Figure 1.

Demonstration of the FDG PET/CT image and the SUV measurement for FDG uptake of bone marrow. This 69-year-old man was diagnosed with stage III DLBCL. Maximal intensity projection (MIP) of the pretreatment FDG PET revealed multiple high grade FDG-avid lesions in the right parotid, right axillary, left inguinal regions, as well as the spleen (arrows in A). Using CT image for localization, the maximal SUVst was recorded by placing the ROIs over the sternum slice by slice (arrow in D). His maximal SUVt and SUVst were 15.1 and 1.78, respectively. Thereafter, he received treatment with R-CHOP regimen. However, the patient expired 10 months after diagnosis due to progression of the disease. A = MIP, B = CT, C = PET, D = fused PET and CT images.
