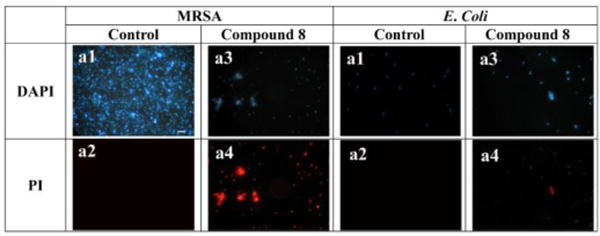
Fig. 2.

Fluorescence micrographs of MRSA and E. coli that were treated or not treated with 10 µg/mL of 8 for 2 h. a1, control, no treatment, DAPI stained; a2, control, no treatment, PI stained. a3, treatment with 8, DAPI stained; a4, treatment with 8, PI stained. Scale bar = 10 µm.
