Figure 2.

Clustering by drinking status.
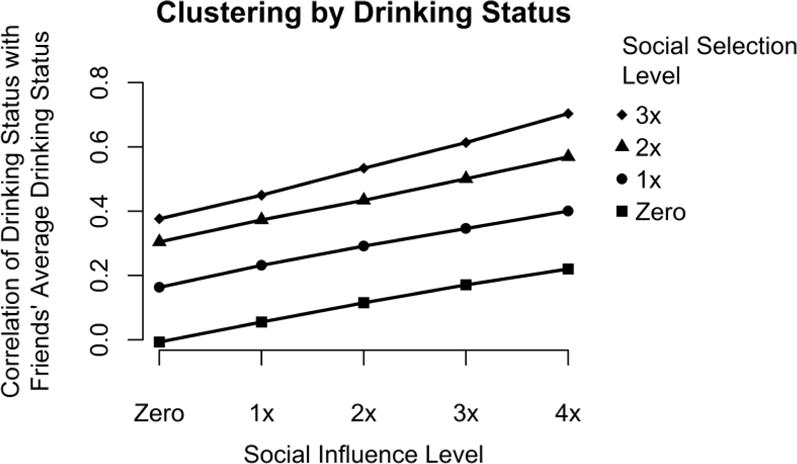
Clustering represented as mean Pearson correlations between drinking statuses and the mean drinking statuses of friends. See Table 1 for explanation of social influence and social selection values.

Clustering by drinking status.
Clustering represented as mean Pearson correlations between drinking statuses and the mean drinking statuses of friends. See Table 1 for explanation of social influence and social selection values.