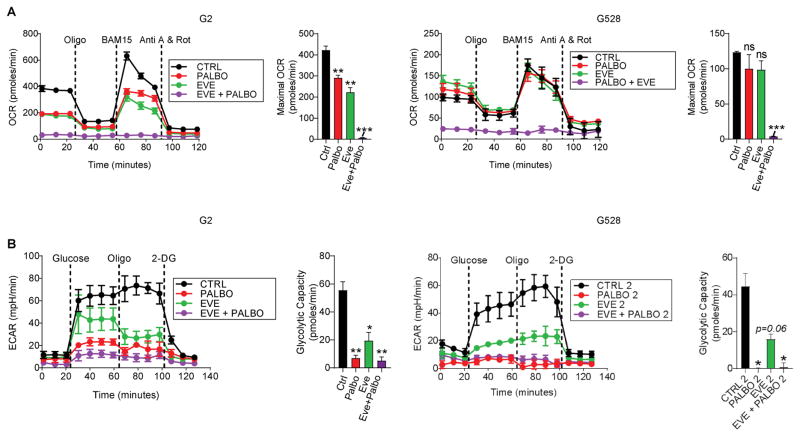
Figure 3. Combined CDK4/6 and mTOR inhibition disrupts GIC metabolism.
(A) Oxygen consumption rate (OCR) and the maximal OCR were measured using a Seahorse XF 24 Flux Analyzer in two GIC lines made adherent as per Methods and subjected to a mitochondrial stress test. (B) Extracellular acidification rate (ECAR) and the glycolytic capacity were measured in two GIC lines subjected to a glycolytic stress test (*P < 0.05; **P < 0.001; ***P < 0.0001; one-way ANOVA with post-hoc Tukey analysis. Values are mean ± SEM of triplicates). Doses for palbociclib and everolimus were 1 μM and 2 μM, respectively.

