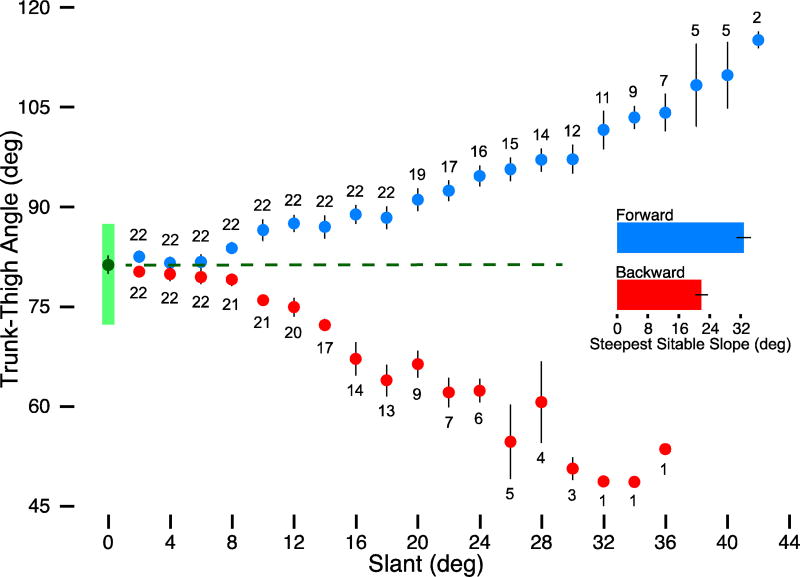
Figure 3.
Summary of major findings. Trunk-thigh angles and slants are measured in degrees. Blue circles represent the average trunk-thigh angles for the forward direction, and the red circles show the average trunk-thigh angles for the backward direction at each increment of slant. Error bars denote ±1 SE. Light green bar shows the range of baseline trunk-thigh angles with slant set to 0°. The dark green circle and dashed line denote the average baseline trunk-thigh angle. The increasing distance between circles and dashed line emphasizes the faster rate of change in trunk-thigh angle in the backward direction compared with the forward direction. Ns represent the number of infants contributing data at each slant in each direction. All 22 infants contributed data to 2°-18° slants in the forward direction and to 2°–6° in the backward direction. Two infants achieved steepest sitable slopes of 42° in the forward direction and 1 achieved 36° in the backward direction. Bar graph shows the group average for steepest sitable slope for each direction. Error bars denote ±1 SE.

