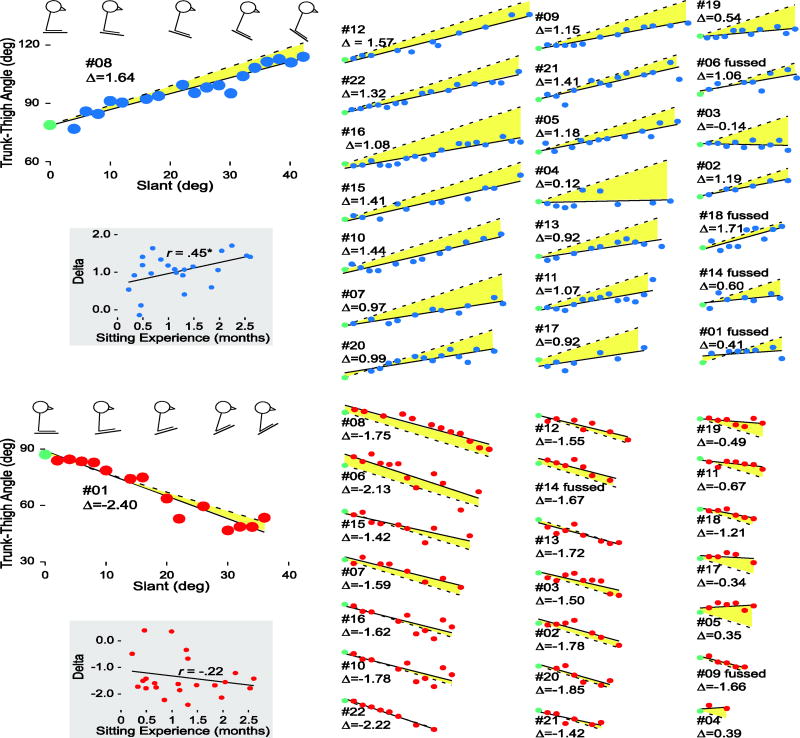
Figure 4.
Individual differences in infants’ ability to cope with forward (top panel) and backward (bottom panel) slopes. Trunk-thigh angles and slants are measured in degrees. Each infant is represented by the same participant number in each direction; infants who fussed out in each direction are noted. Data are ordered in columns by the steepest sitable slope in each direction (steepest sitable slope is also represented by the width of each graph). Large graphs on left side of each panel show the most successful infant in each direction and the extent of the axes. Stick figures above each graph illustrate (A) the increase in infant #08’s trunk-thigh angle from baseline to steeper slants and (B) the decrease in infant #01’s trunk-thigh angle from baseline to steeper slants. The legs-down posture in A and legs-up posture in B reflect the thigh angle relative to horizontal; the trunk position shows infant’s trunk relative to vertical. Circles represent trunk-thigh angle at each observed degree of slant. Delta values (Δ), the change in trunk-thigh angle across slants, are denoted for each infant in each direction based on the fitted regression line through each infant’s data (solid lines). Dashed lines represent the optimal regression line if infants adjusted their trunk-thigh angle from baseline by 2° for each 2° increase in slant. Size of the yellow colored region between the solid and dashed lines reflects infants’ deviation from optimal responding. Scatterplots in gray boxes on left side of each panel show delta values across months of sitting experience.

