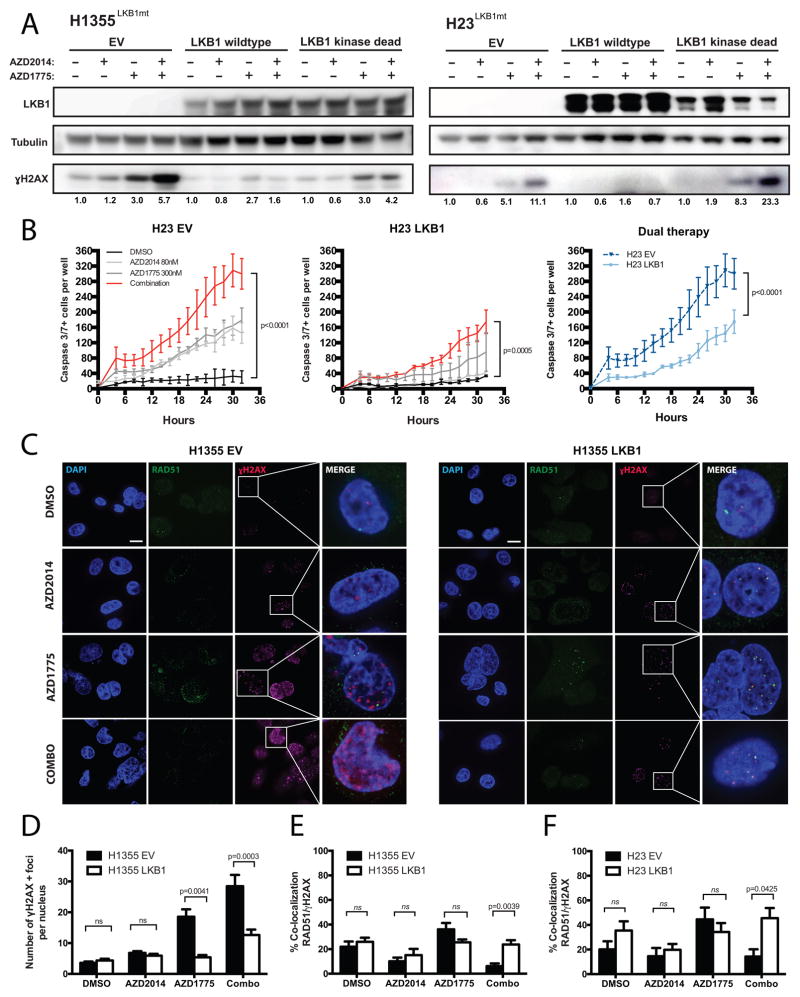
Figure 6. Loss of LKB1 in KRAS-mutant cell lines confers sensitivity to dual WEE1 and mTOR therapy due to impaired HR repair.
(A) Western blot analyses on H1355 and H23 expressing either empty vector (EV) control, human wild type (WT) LKB1, or kinase-dead (KD) LKB1 showed changes in γH2AX protein levels after treatment with either AZD2014 (80nM), AZD1775 (300nM), or dual therapy for 48 hours. Corresponding γH2AX protein quantification normalized to tubulin loading controls are shown below. (B) Live time-course imaging was used to measure the mean number of caspase3/7-positive cells upon indicated drug treatment on H23 EV cells (left panel) and H23 LKB1 cells (middle panel). Right panel shows a comparison between H23 EV and -LKB1 cells co-treated with AZD1775 and AZD2014. Each time point represents 3 wells in duplicates (n=6). (C) Detection of RAD51, γ-H2AX and DAPI by immunofluorescence in H1355 cells expressing EV or LKB1 WT, untreated or treated with either AZD2014 (80nM), AZD1775 (300nM), or in combination. Representative foci-containing cells are shown at high power magnification (100x). Scale bar: 10μm. (D) Mean number of γH2AX-foci per nuclei after 48 hours of treatment with either 80nM AZD2014, 300nM AZD1775 or in combined agents. Over 80 nuclei were analyzed in H1355-LKB1 cells over three experiments. (E-F) Mean number of nuclei containing ≥ one γH2AX and RAD51 co-localized foci by immunofluorescence in H1355 (E) and H23 (F) cells including either EV or LKB1-WT constructs. Cells were treated with either 80nM AZD2014, 300nM AZD1775 or in combination for 48-hours. (ns: not significant, p>0.05)

