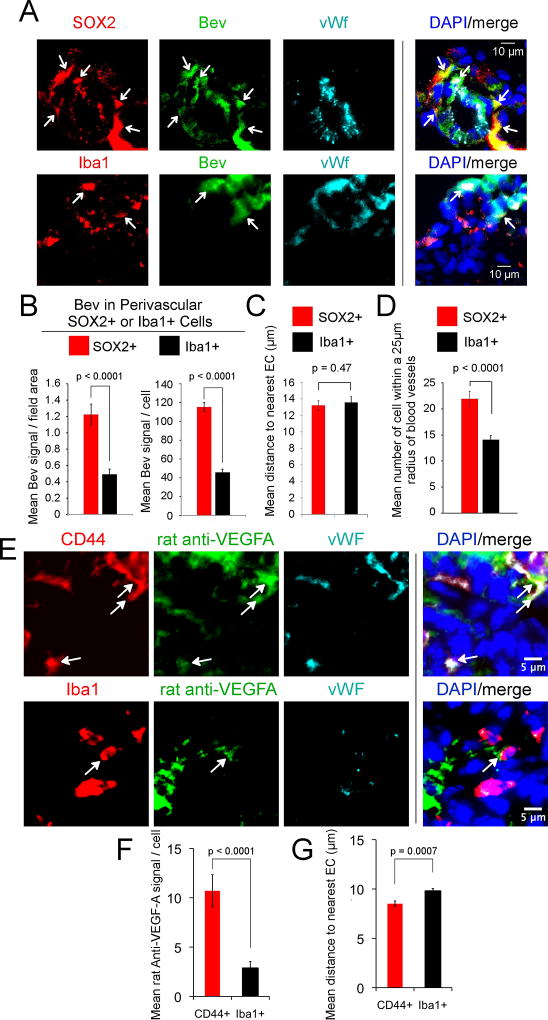
Figure 1.
Bevacizumab gains access to the perivascular tumor space and is internalized predominantly by perivascular Sox2+/CD44+ tumor cells in PDX xenograft and syngeneic mouse models of GBM. A–D, PDX GBM tumors (G39 or G59) were injected intracerebrally into the nude mouse (300,000 cells), and treatment with bevacizumab (5 mg/kg, i.p., 2X/week) or placebo initiated on day 13 (G39) or day 28 (G59). Treatment was continued until the development of neurologic signs at day 23 (G39) or day 50–77 (G59), followed by euthanasia, brain harvest, freezing in OCT media, and storage at −80°C. Sections from three mouse tumors from each of the two GBM xenografts treated with bevacizumab were reacted with Alexa-488-anti-hIgG (green) and anti-Sox2 (2.5 µg/ml) or anti-Iba1 (0.5 µg/ml) antibody (red), and rabbit or mouse anti-vWf (5 µg/ml or 2 µg/ml, respectively) antibody (blue), followed by Alexa-594-conjuated- and Alexa-647-conjugated secondary antibodies and DAPI nuclear stain (A). Area of tumor from mouse administered bevacizumab shown. Arrows denote bevacizumab in Sox2+ tumor cells or in Iba1+ activated microglia/macrophages (A). Scale bars denote 10-µm (A). Bevacizumab fluorescent intensity in Sox2+ or in Iba1+ perivascular cells was quantitated as the mean signal intensity/field area and as the mean signal/cell using ImageJ in the six bevacizumab-treated G39 and G59 GBM xenograft tumors (B). The mean distance of bevacizumab-positive Sox2+ or Iba1+ perivascular cell from the nearest EC was quantitated using ImageJ on the same six xenograft tumors (C). The mean number of Sox2+ or Iba1+ cells within a 25-µm radius of vWf-positive blood vessels was quantitated on the same six xenograft tumors (D). E-G, The syngeneic somatic gene transfer model of GBM was generated by intracerebral injection of four 6- to −8-week-old Ntv-a/ink4a–arf−/− mice with RCAS-PDGF-B-HA. After four weeks, treatment with rat anti-mouse VEGF-A IgG (5 mg/kg, i.p., 2X/week) was initiated and continued for 2 weeks, followed by euthanasia, brain harvest, fixation in 4% paraformaldehyde, immersion in sucrose and freezing (−80°C). Tumor bearing sections (5-µm) were reacted with Alexa-488-anti-rat IgG (green), sheep anti-mouse CD44 (5 µg/ml) or rabbit anti-Iba1 (red), and rabbit or mouse anti-vWf, respectively (as above) (blue), followed by Alexa-594 and Alexa-647-conjugated secondary antibodies, and DAPI nuclear stain (E). Rat anti-mouse-VEGF-A fluorescent intensity in CD44+ or in Iba1+ perivascular cells was quantitated as the mean signal intensity/cell using ImageJ in the four mice (F). The mean distance of rat anti-mouse-VEGF-A-positive CD44+ or Iba1+ perivascular cell from the nearest EC was quantitated using ImageJ on the same four tumors (G). Statistical analyses in panels B–D, F&G: linear mixed model.

