Figure 4.
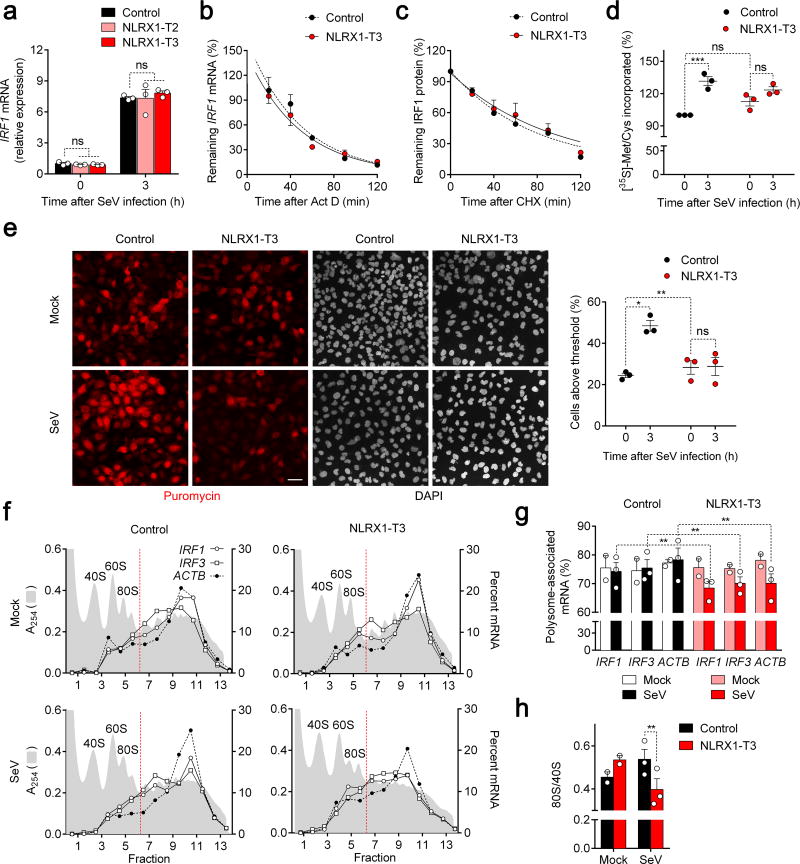
NLRX1 facilitates immediate IRF1 antiviral responses by promoting global protein synthesis in SeV-infected cells. (a) qRT-PCR of SeV-induced IRF1 mRNA responses in control and NLRX1-deficient PH5CH8 cells. (n=3). (b) IRF1 mRNA stability in actinomycin D (Act D)-treated SeV-infected control vs. NLRX1-T3 PH5CH8 cells. (n=3). (c) IRF1 protein stability in cycloheximide (CHX)-treated cells following SeV infection assessed by quantitation of immunoblots. (n=6). See Supplementary Fig. 4b for representative immunoblots. (d) Nascent protein synthesis monitored by [35S]-Met/Cys incorporation in mock- versus SeV-infected control and NLRX1-T3 cells. [35S] incorporated into TCA-precipitated protein is shown relative to that in uninfected control cells (100%). Data are from n=6 technical replicates from three experiments. See Supplementary Fig. 4d for representative immunoblots. (e) Global protein synthesis imaged by confocal microscopy in mock- versus SeV-infected control and NLRX1-T3 cells. Puromycin was detected by staining with specific antibody, and nuclei counterstained with DAPI. Scale bar, 40 µm. The percentage of cells with puromycin labeling exceeding an arbitrary threshold in 3 experiments is shown on the right. An average of 176 cells were evaluated for each condition. (f) Representative polysome profiles of IRF1, IRF3 and ACTB mRNAs in mock- versus SeV-infected control and NLRX1-T3 cells. Absorbance at 254 nm (A254) is aligned with qRT-PCR quantitation of mRNA, plotted as percent of total mRNA in each fraction. (g) Proportion of IRF1, IRF3 and ACTB mRNAs associated with translationally-active polysomes (fractions 7–14) in SeV- (n=3) and mock-infected (n=2) control versus NLRX1-T3 cells. (h) 80S/40S ratios determined from the area under the curve (AUC) of 40S and 80S peaks of A254 traces in 2–3 experiments. Data are shown as mean ± S.E.M. ns = nonsignificant, *p< 0.05; **p < 0.01; ***p< 0.001 by two-way ANOVA (a,d,e,g) or t test (h).

