
Figure 1. TTM counters MAPK-dependent forms of resistance to MAPKi.
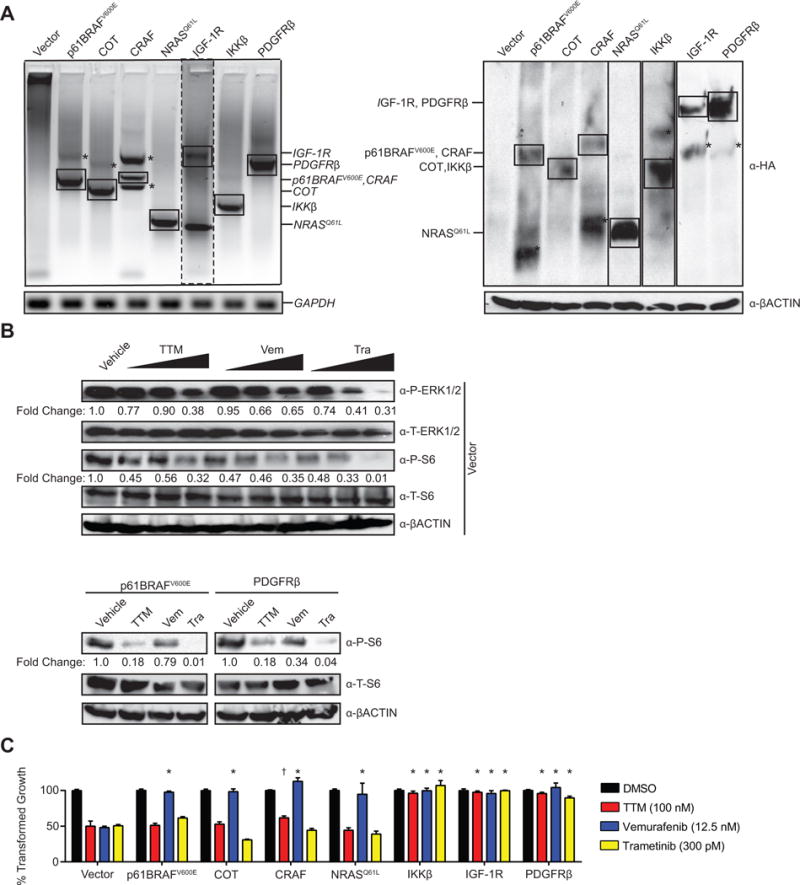
(A) RT-PCR (left) or immunoblot (right) detection of ectopic HA-tagged p61BRAFV600E, COT, CRAF, NRASQ61L, IGF-1R, IKKβ, or PDGFRβ stably expressed in A375 cells. GAPDH and ßACTIN: loading control. *nonspecific amplification or immunoreactivity. (B) Immunoblot detection of phosphorylated (P) or total (T) ERK1/2 and/or S6 in vector control A375 cells treated with vehicle, TTM (25, 50, or 100 nM) vemurafenib; or, vemurafenib (Vem, 3.125, 6.25, or 12.5 nM), or trametinib (Tra, 75, 150, or 300 pM) or A375 cells stably expressing HA-tagged p61BRAFV600E, or HA-tagged PDGFRβ treated with vehicle, TTM (100 nM), vemurafenib (Vem, 12.5 nM), or trametinib (Tra, 300pM) at their IC50 concentrations. ßACTIN: loading control. Bottom: Fold change in phosphorylated to ßACTIN. One of three replicates (see Supplementary Fig. S6, and S7 for other replicates). (C) % transformed growth expressed as the normalized % soft agar colony formation (mean ± s.e.m, triplicate samples, three experiments) of A375 cells stably expressing HA-tagged p61BRAFV600E, COT, CRAF, NRASQ61L, IKKβ, IGF-1R, or PDGFRβ when treated with vehicle (black bar) or the IC50 doses of TTM (red bar), vemurafenib (blue bar), or trametinib (yellow bar). *p<0.01 and **p<0.001 versus vector control cells treated with the same drug. Statistical analysis was performed with two-way Analysis of Variance (ANOVA) with a Bonferroni multiple comparisons post test to compare transformed growth of each cell line with vector control cells treated with the same drug.