
Figure 5. TTM extends survival in a genetically engineered mouse model of melanoma.
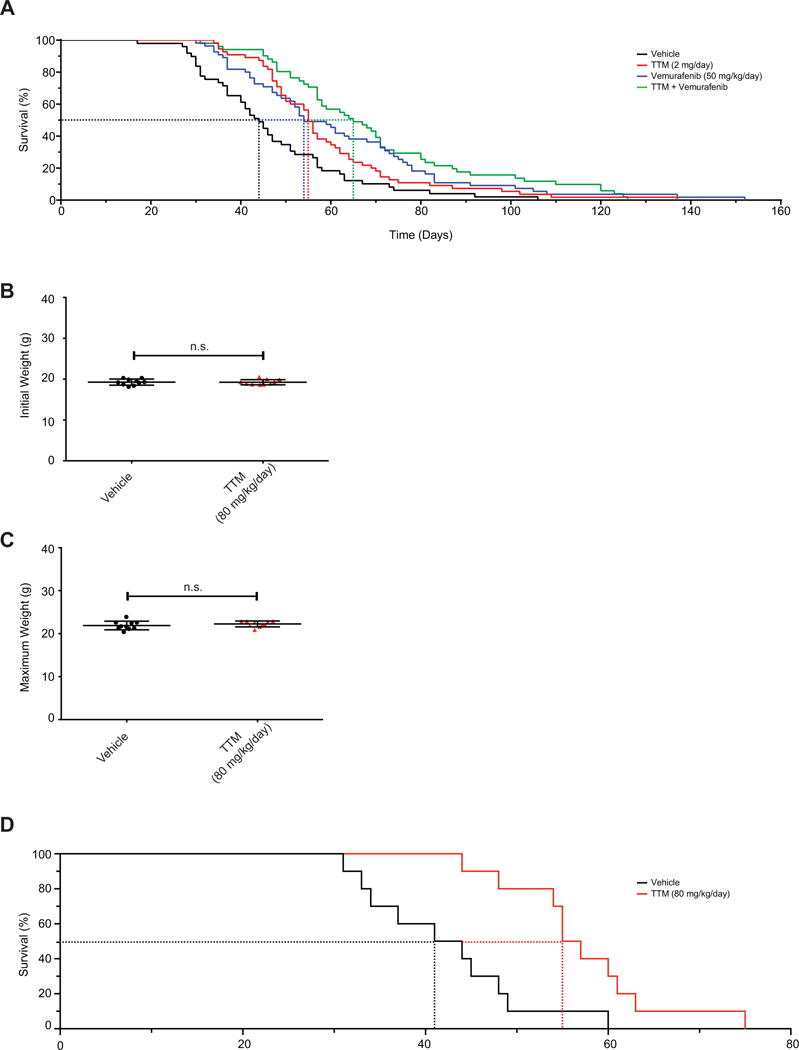
(A) Kaplan-Meier analysis of BPC mice that either reached tumor volume endpoint or lived at least to the median survival for vehicle-treated mice when orally treated daily with vehicle (solid black line, n=49, dotted line: 44 days median survival), TTM (solid red line, n=55, dotted line: 55 days median survival, p=0.004 compared to vehicle), vemurafenib (solid blue line, n=55, dotted line: 54 days median survival, p=0.001 compared to vehicle), or TTM and vemurafenib (solid purple line, n=51, dotted line: 65 days median survival, p=0.0001 compared to vehicle) from the appearance of a pigmented lesion. Statistical analysis was performed with a Mantel-Cox log-rank method to compare each group to vehicle-treated control mice in a pairwise manner. (B, C) Scatter dot plots (mean ± s.e.m) of (B) initial weight at start of treatment or (C) maximum weight obtained during treatment with indicated doses of vehicle (n=10) or TTM (n=10) that either did not reach adverse event endpoint. Statistical analysis was performed with a Student’s t-test. (D) Kaplan-Meier analysis of BPC mice that reached tumor volume endpoint when orally treated daily with vehicle (solid black line, n=10, dotted line: 42.5 days median survival) or TTM (solid red line, n=10, dotted line: 56 days median survival, p=0.0028 compared to vehicle) from the appearance of a pigmented lesion. Statistical analysis was performed with a Mantel-Cox log-rank method to compare each group to vehicle-treated control mice in a pairwise manner.