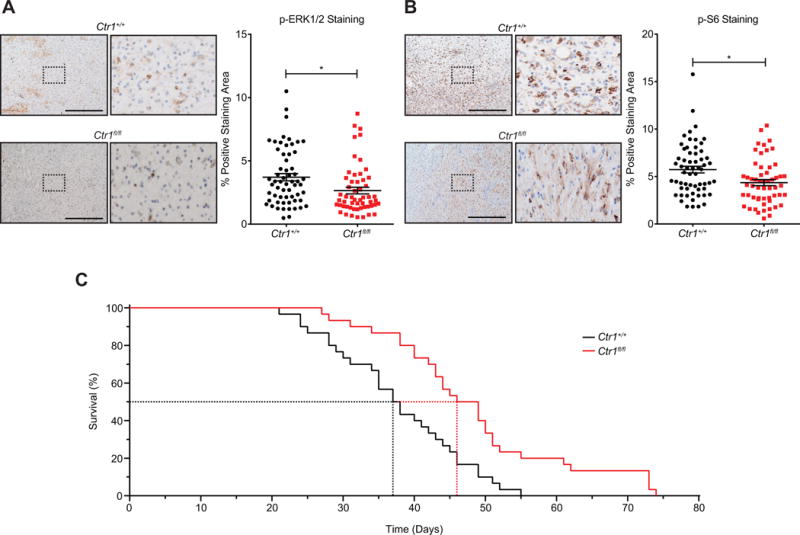
Figure 7. Loss of Ctr1 extends survival in a genetically engineered mouse model of melanoma.

(A) Representative images (scale bar=500 μm) and (B) scatter dot plots (mean ± s.e.m) of % positive-staining area per field for immunohistochemical detection of P-ERK1/2 (n≥11 mice from each cohort, 5 fields per mouse) or P-S6 (n≥11 mice from each cohort, 5 fields per mouse) in tumors at endpoint from randomly selected Ctr1+/+ versus Ctr1fl/fl BPC mice. *p<0.01. Statistical analysis was performed with a Student’s t-test. (C) Kaplan-Meier analysis of Ctr1+/+ (solid black line, n=30, dotted line: 37.5 days median survival) or Ctr1fl/fl (solid red line, n=30, dotted line: 47.5 days median survival, p=0.001 compared to Ctr1+/+) BPC mice. Statistical analysis was performed with a Mantel-Cox log-rank method to compare Ctr1+/+ to Ctr1fl/fl mice.
