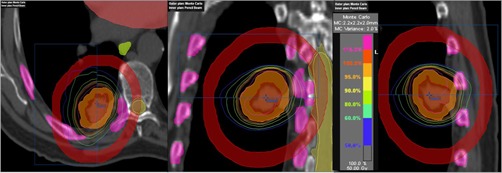
Figure 4.

Comparison of the isodose distributions generated via XVMC (outer window) vs. PB‐hete (inner window) on representative axial (a), coronal (b), and sagittal (c) views for a representative NSCLC patient treated with SBRT. Target volumes contoured include ITV (orange, innermost) and followed by PTV (red, outermost). Higher isodose lines, such as 50 Gy (100%), 47.5 Gy (95%), 40 Gy (80%), exhibit sharp dose falloff. The maximum point dose to the PTV was 62.9 Gy (126%) in XVMC vs. 67.9 Gy (136%) in PB‐hete algorithms. The 25 Gy (50%) isodose line was mainly in the ipsilateral lung parenchyma for both algorithms. However, PB‐hete overestimated dose to the PTV as well OARs including normal lung. Other OARs, such as spinal cord, esophagus, heart, and ribs contours, are also shown in the 3D image views. Red color ring was contoured to calculate (%).
