
Figure 7.
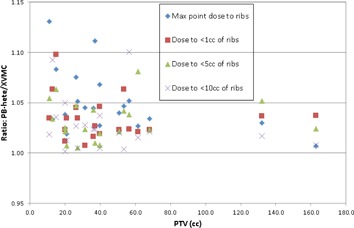
Scatter plot showing ratios of maximum point dose to rib; dose to , , and of ribs calculated by PB‐hete and XVMC algorithms. For the identical beam geometry, MLC margins, and same number of MUs, the PB‐hete algorithm overestimated maximum rib point dose, dose to , , and of ribs by 5%, 3%, 3%, and 3%, on average, respectively, compared to XVMC.