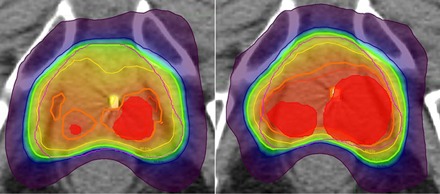
Figure 1.

Representative axial slice showing the dose distribution for one patient. The left shows the (shaded red) with 0 mm margin and the right with a 5 mm margin. The thick orange isodose line is 89.3 Gy and the thick green isodose line is 76 Gy. Note that with the 5 mm margin the 89.3 Gy isodose line is pushed away from the rectum, requiring a hotter plan to achieve adequate coverage.
