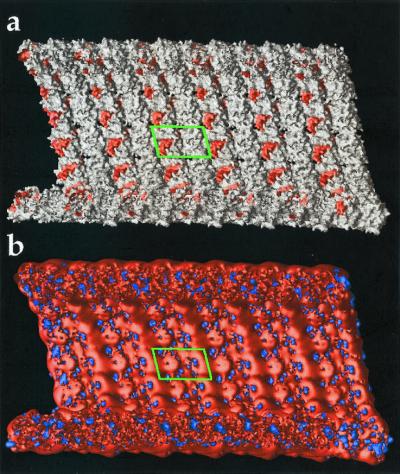
Figure 4.
Electrostatic properties of microtubule interior. Cross-section view with − end to the left and tubulin dimer outlined by green box. (a) View of microtubule molecular surface with regions implicated in vinblastine, colchicine, and taxol binding shown in red. (b) Same view of microtubule with electrostatic potential isocontours at +1 kT/e (blue) and −1 kT/e (red). Potential calculated as in Fig. 3.

