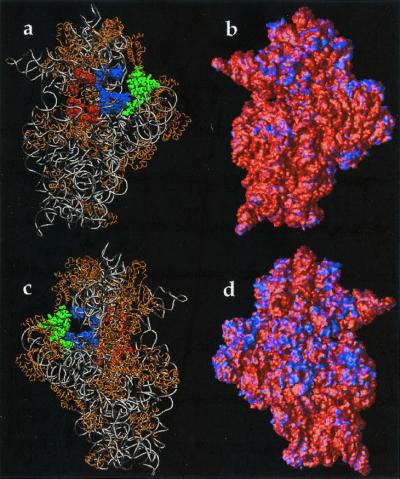
Figure 5.
Electrostatic properties of the 30S ribosomal subunit. Potential obtained by solution of the LPBE at 150 mM ionic strength with a solute dielectric of 2 and a solvent dielectric of 78.5 by using the 30S structure from the 1FJG Protein Data Bank entry (29, 34). (a) Front view (face that contacts the 50S subunit) of the 30S backbone with protein shown in gold; nucleic acids shown in silver. Selected components of the A-site (16S residues 525–535, 955–965, 1055–1060, 1490–1493; S12 residues 45–49) are shown in red, components of the P-site (16S residues 789–791, 925–927, 965–967, 1229–1230, 1338–1341, 1399–1403, 1497–1499; S9 residues 124–128; S13 residues 122–126) are shown in blue, and components of the E-site (16S residues 691–695, 792–797; S7 residues 80–90, 150–170; S11 residues 45–60) are shown in green. (b) Front view of the electrostatic potential mapped on the 30S molecular surface; a blue color indicates regions of positive potential (> +2.6 kT/e) whereas red depicts negative potential (< −2.6 kT/e) values. (c) Back view (opposite the 50S-binding face) of the 30S backbone. (d) Back view of the electrostatic potential mapped on the 30S molecular surface.

