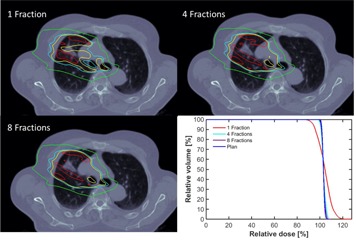
Figure 4.

Beam interplay with organ motion for a representative patient with locally advanced non‐small cell lung cancer. Dose distributions of 1, 4, 8 treatment fractions are shown in top left, top right, and bottom left, respectively. The bottom right shows the DVH of iCTV for 1, 4, and 8 treatment fractions accounting for interplay and original treatment plan without accounting interplay. Dark red, red, yellow, magenta, and green contours represent the isodose lines of 110%, 105%, 100%, 95%, and 50% of the prescription dose.
