
Figure 7.
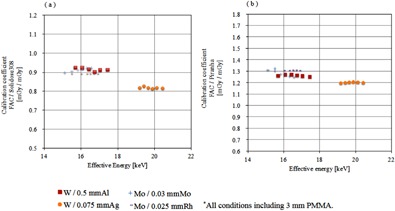
Calibration coefficients of semiconductor dosimeter plus a correction factor. X‐axis of the graph effective energy (keV), y‐axis shows the calibration coefficient: (a) is Solidose 308, (b) is a graph showing the calibration coefficient of the Piranha.