
Figure 2.
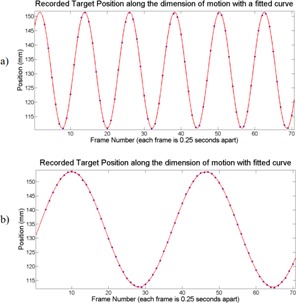
The measured target position along the dimension of motion in each frame. The automatic contour's centroid was used as a mark of position in each frame. The solid curve represents the sinusoidal curve fit generated with MATLAB. Figure 2(a) shows the motion quantification for the most rapid trajectory (3 s per cycle), while Fig. 2(b) represents the slowest trajectory (9 s per cycle). The target was driven at an amplitude of 20 mm.