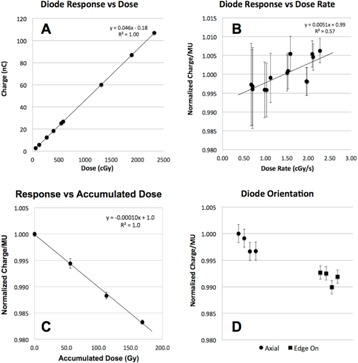
Figure 5.

Plot (a) showing that diode response is linear with respect to dose from 0.6 to 23 Gy. Plot (b) showing diode response is uniform with respect to dose rate from 0.7 to 2.3 cGy/s. The diode (c) displays a linear decrease in response of per 100 Gy. Plot (d) showing diode response is essentially independent of orientation (i.e., whether detector is oriented such that the beam is incident parallel or perpendicular to the detector axis).
