Fig. 2.
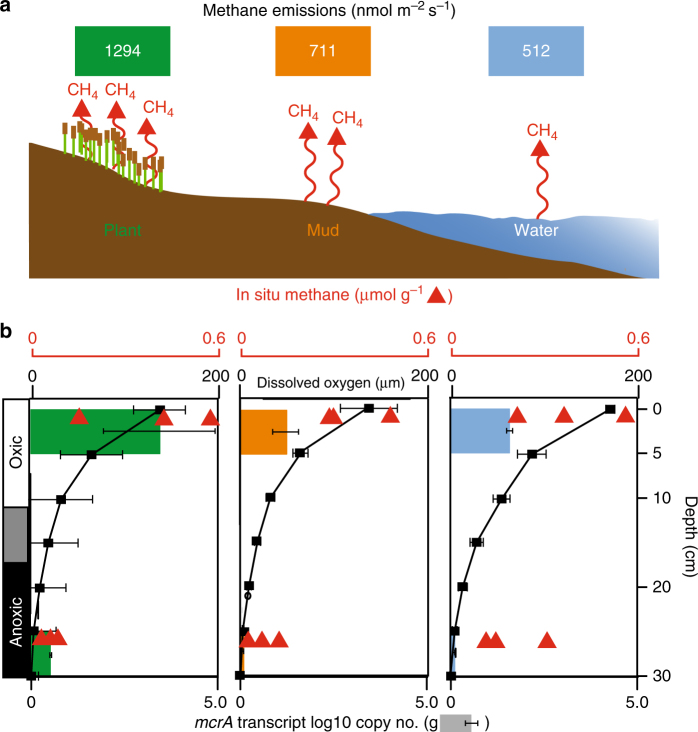
The relationship between soil dissolved oxygen concentration and methanogenic activity with depth and ecosites from Summer. a Schematic of the three ecosites examined in this study with methane emissions shown in colored boxes and depicted by red lines (Supplementary Fig. 2A). b Dissolved oxygen concentrations (black boxes), transcripts for mcrA (colored bars), and porewater methane concentrations (red triangles) in soils. Error bars reflect s.e. (mcrA) and s.d. (oxygen); n = 3

