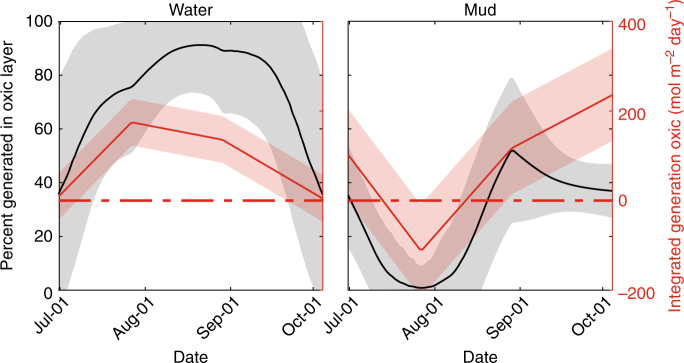
Fig. 4.
Percent methane generated in ecosites over the season as determined from the diffusion and generation model. These data represent a synthesis of the 10% best performing realizations of the microbial activity terms (R(t,z)) as determined by the Markov chain. Red lines show the integrated production/consumption of CH4 over the oxic zone, interpolated over time. The heavy red dashed line indicates the net neutral methane generation point. Black lines represent the fraction of methane production that can be attributed to the strictly oxic layer (i.e., production above the 97.5th percentile line of the oxic horizon). The shaded areas of both lines represent 1 s.d. of the 4000 R(t,z) realizations. Oxic layers were almost always a net source, with the exception of August in the mud ecosite. The percent contribution depended on the total production within the soil column as well as the level of production in the oxic layers. As the footprint of the site is primarily open water (97% when accounting for only open water and mud, as we do here), the percent generation curve of open water dominated the site-level budget when calculating the total percent generation in the oxic layers

