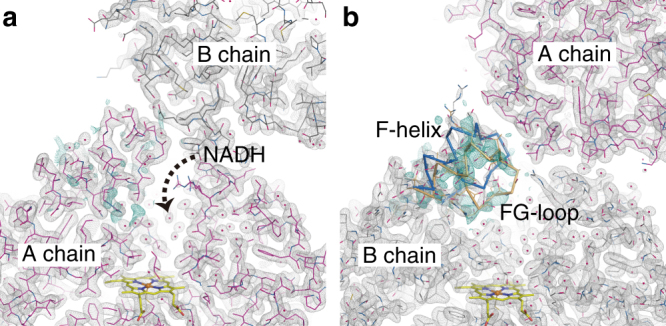
Fig. 5.

Structure of the NADH channel entrance in the a A and b B chains of resting P450nor at ambient temperature. The 2F o−F c maps are shown in gray and contoured at 1.0σ. The F o−F c positive maps are shown in turquoise and contoured at 2.3σ. The structure factor F c was calculated from the open form (blue Cα trace) of the NADH channel. The refined structure of the closed form is shown in orange (40% occupancy). The structures using the “Dark2” data of MC-2 are presented
