Fig. 2.
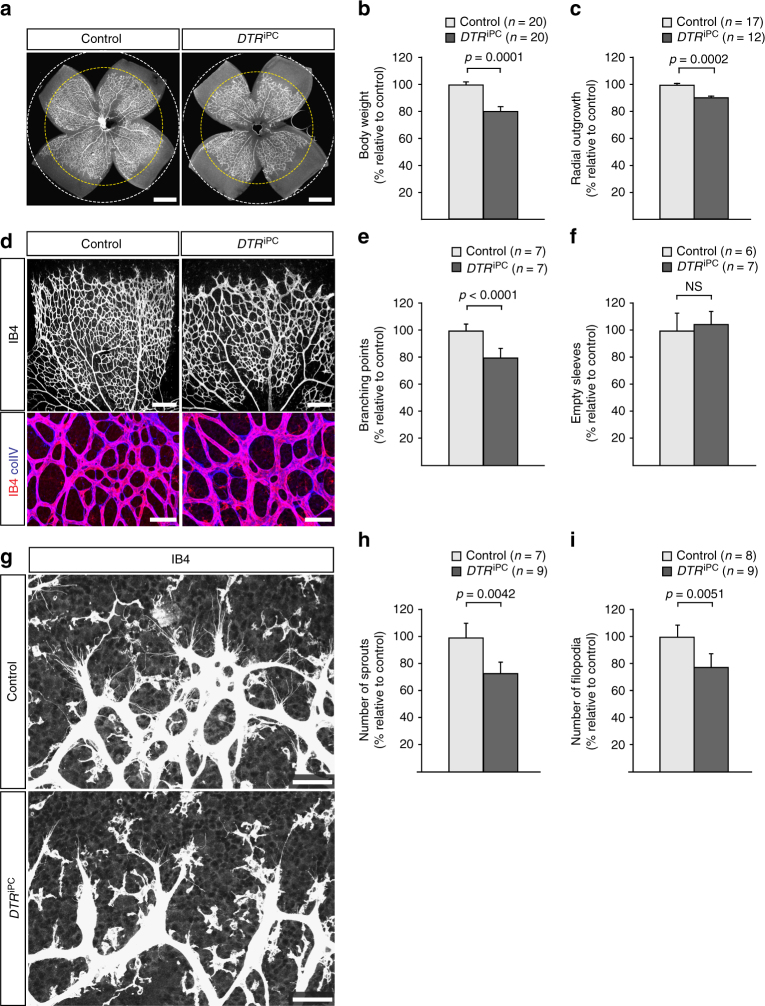
Altered endothelial sprouting after pericyte depletion. a Isolectin B4-stained P6 control and DTR iPC retina whole-mounts. Dashed circles indicate vessel-covered (yellow) and peripheral avascular (white) areas, respectively. Scale bar, 500 µm. b, c Quantitation of P6 control and DTR iPC body weight b and radial outgrowth of the retinal vasculature c. Error bars, s.e.m. p-values, Student’s t-test. d Confocal images of IB4 (white/red) and collagen IV (colIV, blue) showing the reduction of branch points but no increase in IB4- colIV+ empty matrix sleeves in DTR iPC P6 retinas. Scale bar, 200 µm (top panels) and 50 µm (bottom). e, f Quantitation of branch points e and empty matrix sleeves f in P6 retinas. Error bars, s.e.m. p-values, Student’s t-test. NS, not statistically significant. g Maximum intensity projection of the IB4-stained P6 control and DTR iPC retinal angiogenic front illustrating differences in sprout number, morphology and filopodia number after pericyte depletion. Scale bar, 50 µm. h, i Quantitation of sprouts h and filopodia number i in the P6 control and DTR iPC angiogenic front. Error bars, s.e.m. p-values, Student’s t-test

