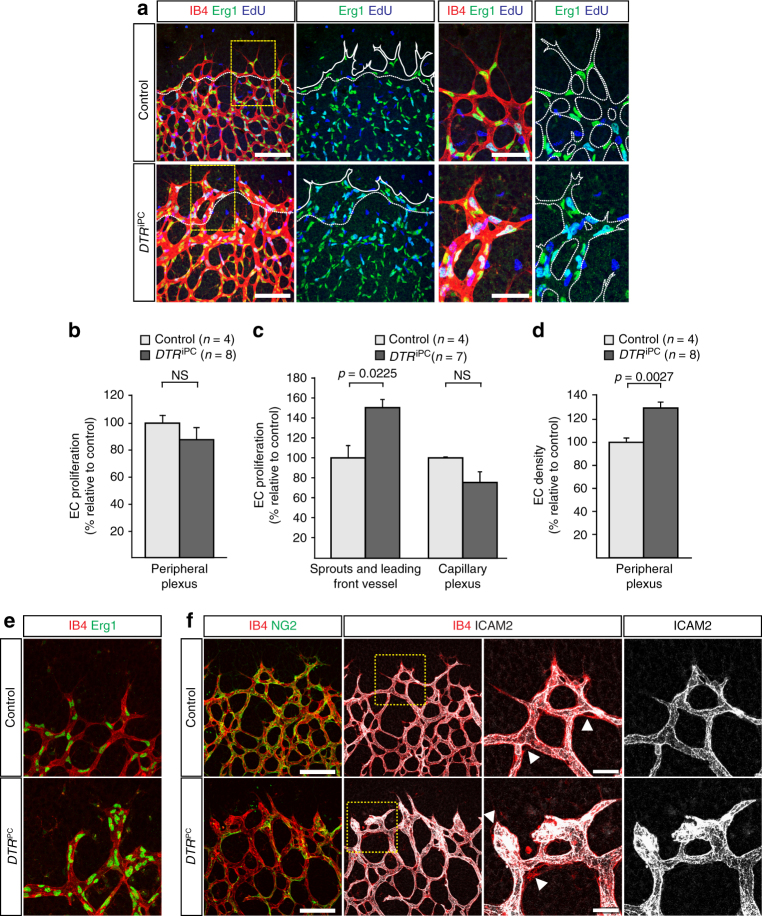
Fig. 3.
Pericytes control endothelial behavior in angiogenesis. a Confocal images showing proliferating cells (EdU, blue), IB4 (red) and EC nuclei (Erg1, green) in the P6 control and DTR iPC retinal angiogenic front, as indicated. Images on the right show higher magnification of boxed insets in left column. Dashed lines outline the angiogenic leading vessel from where the sprouts emerge (second column) or vessel shape (fourth column) at the edge of the vascular plexus. Scale bar, 100 µm (left panels) and 50 µm (higher magnifications). b–d Quantitation of total b and regional EC proliferation c as well as EC density d within the peripheral vascular plexus of P6 control and DTR iPC retinas. Error bars, s.e.m. p-values, Student’s t-test. NS, not statistically significant. e High magnification of IB4 (red) and Erg1 (green) stained sprouts highlighting the accumulation of EC nuclei in P6 DTR iPC but not control sprouts. Scale bar, 50 µm. f Confocal images showing IB4 (red), NG2+ pericytes (green) and vessel lumen (ICAM2, white) in the control and DTR iPC angiogenic front of P6 retinas. Images on the right show higher magnification of boxed insets in the second column. Note that IB4 signal covers a larger area than the apical ICAM2 immunostaining (arrowheads in third column). Scale bar, 100 µm (left panels) and 50 µm (higher magnifications)

