Fig. 7.
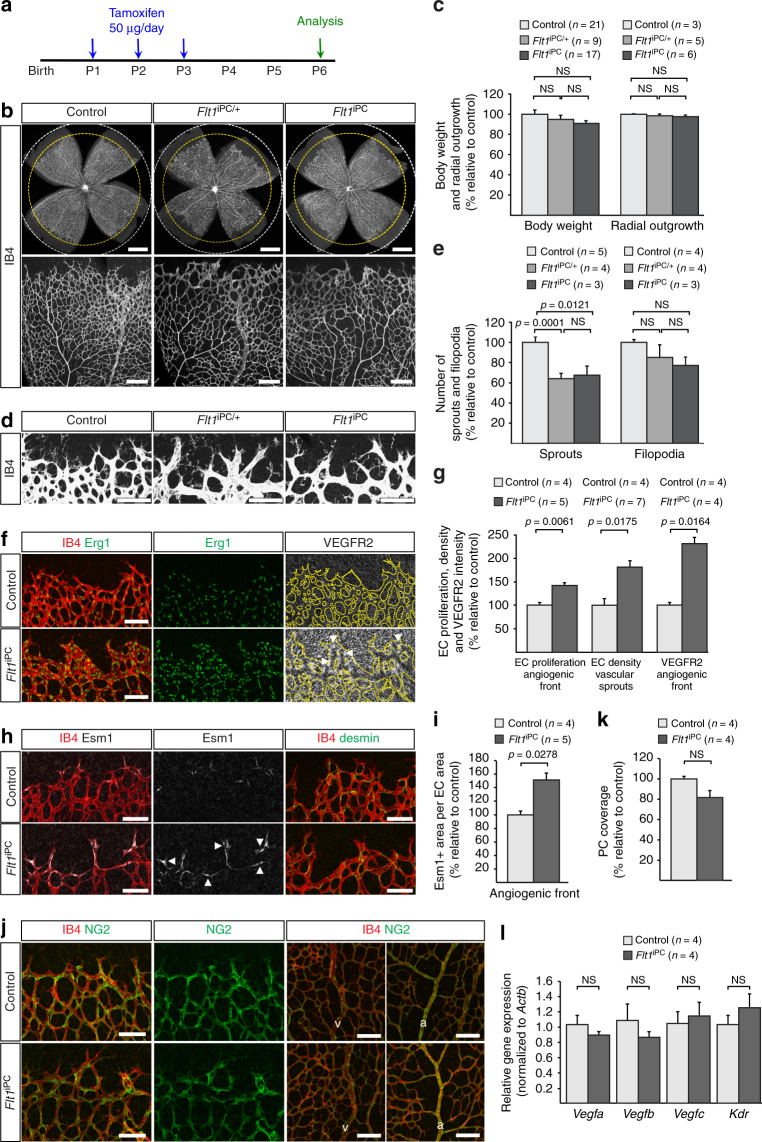
Inactivation of Flt1 in PDGFRβ+ cells. a Experimental scheme of tamoxifen administration for the generation of Flt1 iPC mutants. b P6 control, Flt1 iPC/+ and Flt1 iPC retinas stained with isolectin B4 (IB4). Dashed circles indicate vessel-covered (yellow) and peripheral avascular (white) areas in the overview pictures (top). Scale bar, 500 µm. c Quantitation of body weight and radial outgrowth of the retinal vasculature in control, Flt1 iPC/+ and Flt1 iPC P6 pups. Error bars, s.e.m. p-values, one-way ANOVA. NS, not statistically significant. d Confocal images of the IB4-stained P6 control, Flt1 iPC/+ and Flt1 iPC retinal angiogenic front illustrating differences in sprout number and morphology. Scale bar, 100 µm. e Quantitation of sprouts and filopodia in P6 control, Flt1 iPC/+ and Flt1 iPC retinas. Error bars, s.e.m. p-values, one-way ANOVA and Tukey’s multiple comparison test. NS, not statistically significant. f Confocal images of IB4 (red), Erg1 (green) and VEGFR2 (white) stained P6 retinas highlighting the accumulation of EC nuclei and enhanced VEGFR2 immunosignals (arrowheads) in Flt1 iPC sprouts. Vessels are outlined by dashed lines on the right panel. Scale bar, 100 µm. g Quantitation of EC proliferation (EdU+ Erg1+) at the angiogenic front, EC density in sprouts and leading front vessel and VEGFR2 immunosignals intensity in the angiogenic front of control and Flt1 iPC P6 retinas. Error bars, s.e.m. p-values, Student’s t-test. h Esm1 (white) expression (arrowheads) in the angiogenic front (IB4+, red, first two columns) and detection of desmin+ pericytes (green, third column) in P6 control and Flt1 iPC retinas. Scale bar, 100 µm. i Quantitation of Esm1+ proportion relative to vascular area (IB4+) in the angiogenic front of control and Flt1 iPC P6 retinas. Error bars, s.e.m. p-values, Student’s t-test. j Confocal images of P6 retinas stained for NG2 (green) and IB4 (red) showing no significant changes in pericyte coverage in the front (first two columns) or the remodeling plexus around veins (v) or arteries (a) (last two columns). Scale bar, 100 µm. k, l Quantitation of pericyte coverage k and relative gene expression by qPCR on whole lysates l in control and Flt1 iPC P6 retinas. Error bars, s.e.m. p-values, Student’s t-test. NS, not statistically significant

