Fig. 4.
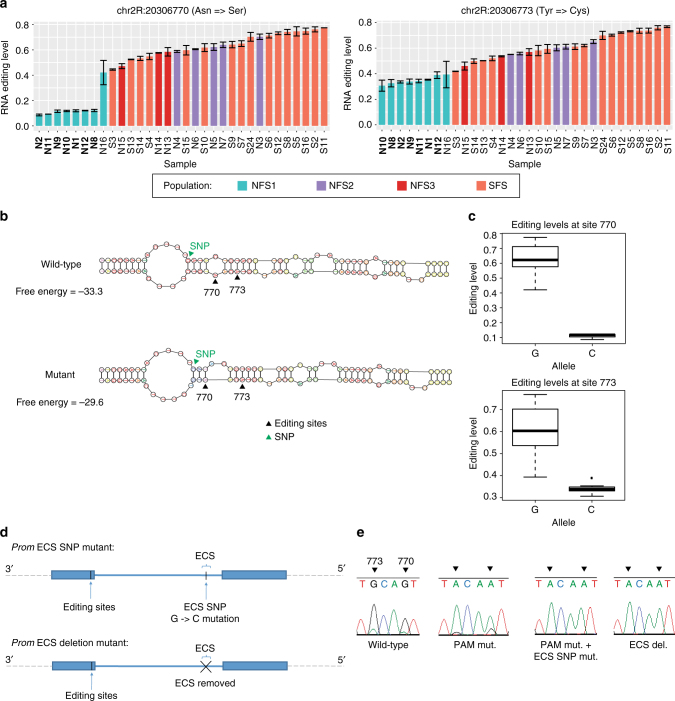
An intronic SNP affects prominin editing levels. a Prominin editing levels for each of the 32 Evolution Canyon fly lines. The editing levels for each sample represent the average editing levels of two biological replicates. The sub-populations are labeled as follows: NFS1 (turquoise), NFS2 (purple), NFS3 (red), SFS (orange). Samples in bold represent those that have the SNP that is correlated with prominin editing levels. Error bars represent standard error of the mean. b RNA structure predictions for the prominin editing sites and their corresponding ECS, for both wild-type prominin and with the SNP in the prominin ECS that is correlated with its editing levels. c Boxplot showing editing levels for prominin site 770 and site 773, for 7 Evolution Canyon fly lines with wild-type alleles and 25 Evolution Canyon fly lines with mutant alleles. The editing levels for both sites are represented by 7 NFS1 lines and 16 SFS lines. d Schematic showing the prominin ECS deletion and ECS SNP mutation. e Sanger sequencing traces showing prominin editing levels in whole bodies of wild-type, PAM mutant, PAM mutant with ECS SNP mutant, and ECS deletion mutant flies. Each trace represents editing levels from a single fly

