Fig. 3.
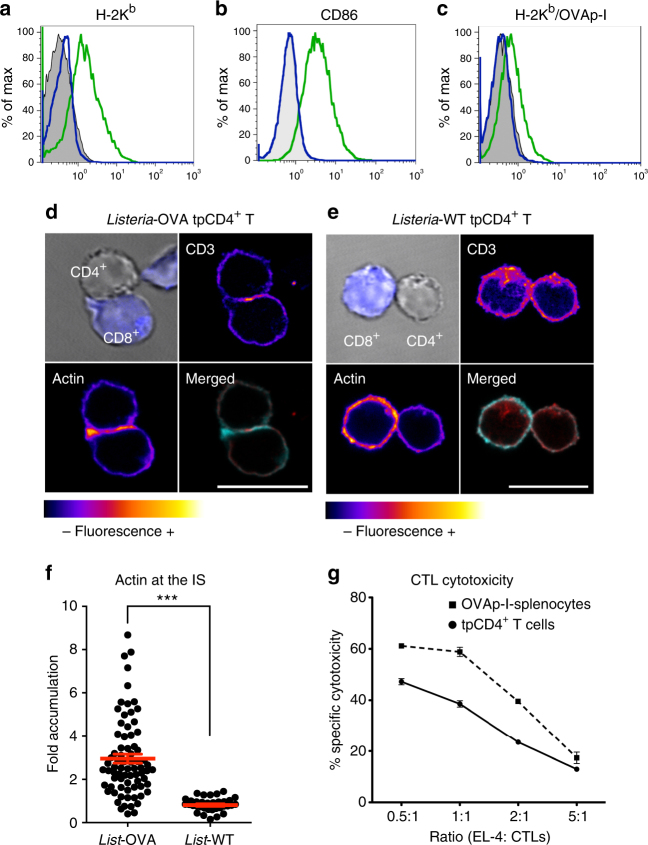
tpCD4+ T cells establish immune synapses with naive CD8+ T cells. H-2Kb (a) or CD86 (b) expression on CD4+ T cells before (blue line) and after Listeria-OVA transphagocytosis (green line). Antibody negative controls are shown (grey). c H-2Kb/OVA expression on Listeria-OVA tpCD4+ T cells, 24 (blue) or 48 h (green) post-transphagocytosis and on non-transphagocytic T cells (grey). Confocal images of Listeria-OVA (d) or Listeria-WT tpCD4+ T cells (e) incubated 1 h with OT-I naive CD8+ T cells (blue). CD3 and actin fluorescence is shown on a “fire” scale. Merged images show actin (cyan) and CD3 (red). Bars = 10 μm. f Quantification of actin accumulation at the IS analyzed using Synapse measures software31. Naive OT-I CD8+ T cells were conjugated with Listeria-OVA or Listeria WT tpCD4+ T cells and fluorescence microscopy was performed as in d and e. Each dot represents the fold increase of actin accumulation in the IS in an individual CD8+/tpCD4+ T cell contact from three independent experiments, the mean and the s.e.m. are shown in red. ***P < 0.001 (analyzed by Mann–Whitney U-test). g Relative specific cytotoxicity of effector CD8+ T cells (CTL) activated by Listeria-OVA tpCD4+ T cells (solid line) or by OVAp-I-loaded splenocytes (dashed line). Various EL-4 (target cell):CTL ratios were measured

