Fig. 4.
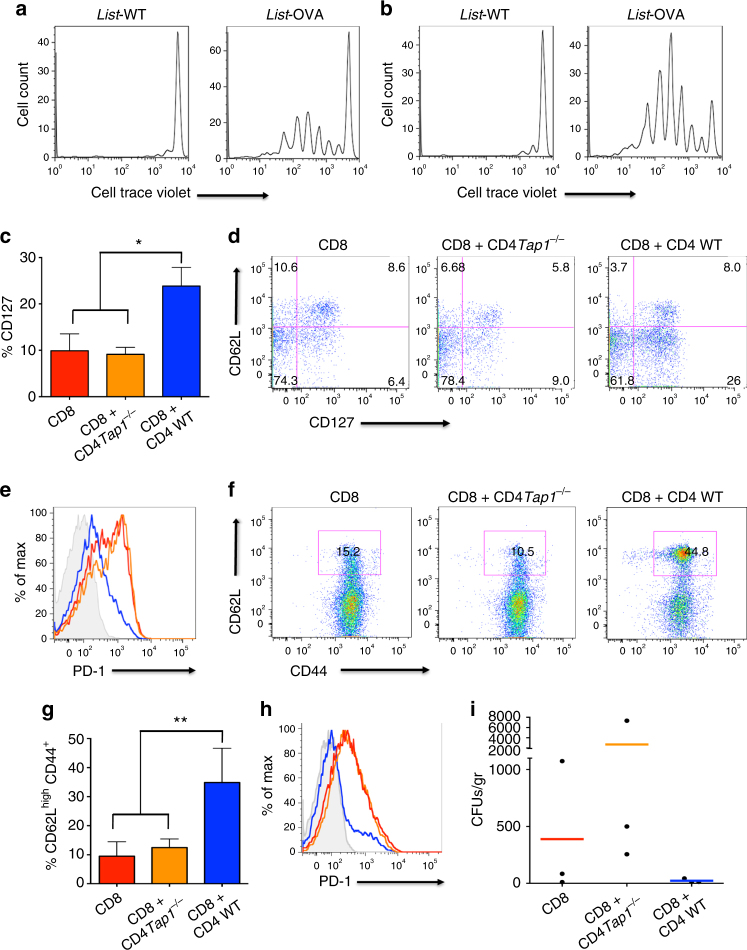
tpCD4+ T cells-mediated antigen presentation generates CD8+ T central memory. a, b In vivo proliferation of CellTrace Violet-stained OT-I CD8+CD45.1+ T cells, injected into recipient C57BL/6 CD45.2+ mice. Listeria-WT or Listeria-OVA tpCD4+ T cells (2 × 10⁶, a; 5 × 10⁶, b) were adoptively transferred. Proliferation was analyzed 3 days post-transfer. c–h, Analysis of memory CD8+ T cell generation in vivo. Rag1−/− mice were adoptively transferred i.v. with WT CD8+ T cells (group 1), Tap1−/− CD4+ T plus WT CD8+ T cells (group 2), and WT CD4+ T plus WT CD8+ T cells (group 3). The following day, all mice were challenged with L. monocytogenes (103 bacteria/ per mice; i.v.). At 12 (c–e) or 30 days (f–h) after challenge, the CD8+ T-cell population from spleen was analyzed. FACS gating is indicating in Supplementary Fig. 4B. c Percentage of CD127+, gated on CD3+CD8+CD44+CD62L−, pre-memory T cells. Data shown as mean ± s.d. for 3 mice per group (group 1, red; group 2, orange; group 3, blue). *P < 0.05 analyzed by ANOVA and Bonferroni post-test. d Representative dot plots showing CD62L and CD127 staining from the CD3+CD8+CD44+ T-cell population. e Representative histogram showing PD-1 levels on the CD3+CD8+CD44+ T-cell population (group 1, red; group 2, orange; group 3, blue; Fluorescence Minus One (FMO) control, grey). f Representative dot plots showing CD62L and CD44 staining gated on the CD3+CD8+ T-cell population. The CD62Lhigh population was also positive for CD127 (not shown). g Percentage of CD62LhighCD44+ gated on cells indicated in f (red outline). Data shown as mean ± s.d. for 4 mice per group (group 1, red; group 2, orange; group 3, blue). *P < 0.05 analyzed by ANOVA and Bonferroni post-test. h Representative histogram showing the amount of PD-1 on the CD3+CD8+CD44+ T-cell population (group 1, red; group 2, orange; group 3, blue; FMO control, grey). i L. monocytogenes load in spleen 2 days after a second bacterial challenge (50 days after the first). Each dot represents one mouse (3 mice per group), the mean is shown in red (group 1), orange (group 2) and blue (group 3)

