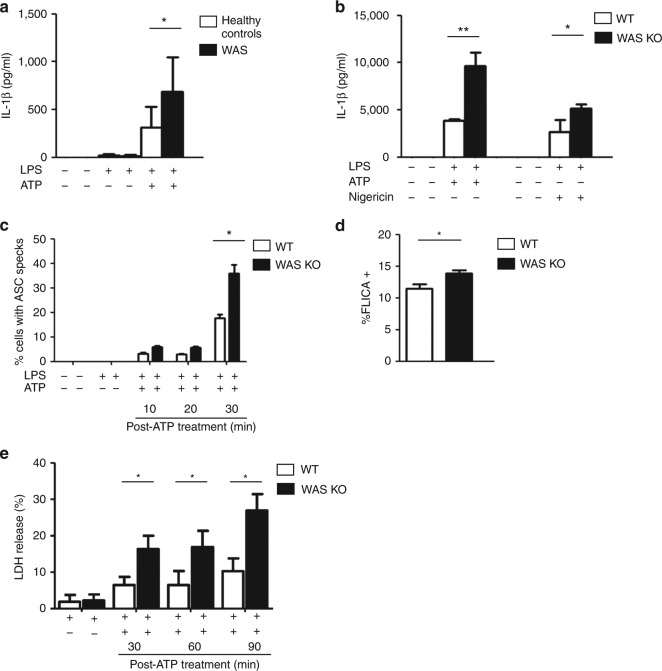
Fig. 1.
Increased NLRP3 activation in WASp-deficient myeloid cells. a CD14+ monocytes from healthy controls (n = 6) and patients with classical WAS (n = 3; Ochs’ score ≥4, and no WASp expression by flow cytometry) were primed with LPS (50 ng/ml) for 3 h, followed by ATP stimulation (3 mM) for 30 min. After stimulation, IL-1β was evaluated in culture supernatants by ELISA. Data presented are mean protein concentration ± SEM performed in duplicates. Two-sided Student’s t-test. b WT or WAS KO BMDCs were primed with LPS (100 ng/ml) for 3 h, followed by stimulation with ATP (5 mM) or nigericin (10 μM) for 30 min. After stimulation, IL-1β in culture supernatants was quantified by ELISA. Data presented are mean protein concentration ± SEM performed in duplicates from three independent experiments. Two-sided Student’s t-test. c WT or WAS KO BMDCs were primed with LPS (100 ng/ml) for 3 h and stimulated with ATP (5 mM) for 10, 20 or 30 min. Cells were fixed and stained for nuclei (blue), ASC (green) and F-actin (red). Images were taken by confocal microscopy (×63 magnification). Percentage of BMDCs containing ASC specks was quantified. Results are mean ± SEM from three independent experiments, with at least 200 cells evaluated in each experiment per time-point. Two-sided Student’s t-test. Representative confocal images are shown in Supplementary Fig. 1G. d WT or WAS KO BMDCs were primed with LPS (100 ng/ml) for 3 h, followed by ATP (5 mM) stimulation for 30 min. Intracellular active caspase-1 was detected by binding of FAM-YVAD-FMK (FAM-FLICA). Cells emitting green fluorescence were detected in the FL-1 gate. Results are mean percent of FLICA+ BMDCs ± SEM from three independent experiments each performed in duplicate. Two-sided Student’s t-test. e WT or WAS KO BMDCs were primed with LPS (100 ng/ml) for 3 h and stimulated with ATP (5 mM) for 30, 60 or 90 min. Time-dependent increase in LDH release was indicative of pyroptotic cell death. LDH measurement upon lysis of control, uninfected cells with 0.1% Triton X-100 was considered 100% release. Data presented represent are mean ± SEM of LDH release from three independent experiments each performed in duplicates. Two-sided Student’s t-test. *p < 0.05; **p < 0.01

