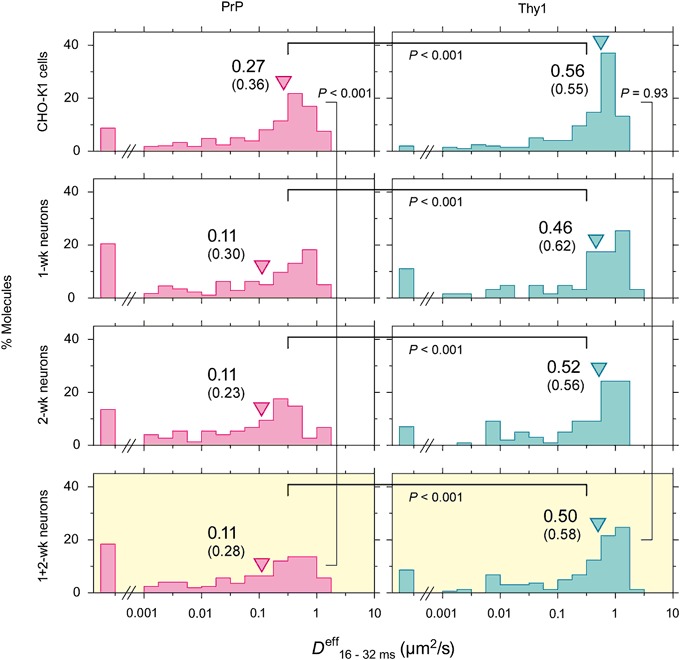
Fig. 3.

The distributions of the effective diffusion coefficients in the time scale between 16 and 32 ms (D eff 16–32ms) of single individual PrP and Thy1 trajectories (left and right columns, respectively). The triangles and the numbers next to them represent median values (in µm2/s). The numbers in parentheses indicate mean values. P values represent the results of the Mann-Whitney U-test. Further details of the D eff 16–32ms data are shown in Table 2
