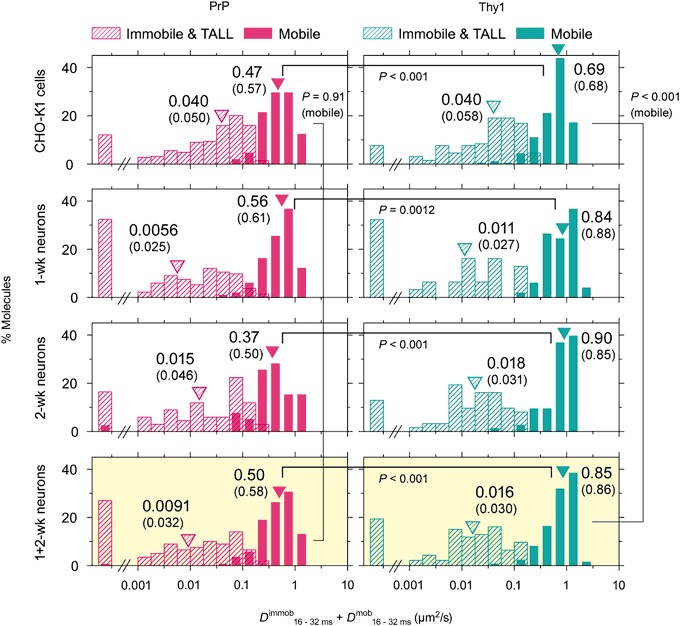
Fig. 4.

The distributions of the diffusion coefficients in the time scale between 16 and 32 ms during the mobile periods and immobile periods (D mob 16–32ms and D immob 16–32ms, respectively) of single individual PrP and Thy1 molecules (left and right columns, respectively). P values represent the results of the Mann-Whitney U-test. The distributions of D immob 16–32ms are shown only for reference purposes, because the results are likely dominated by variations of the noise level for individual fluorescent spots in each image frame (single-molecule localization precisions). Further details of the D mob 16–32ms data are shown in Table 5
