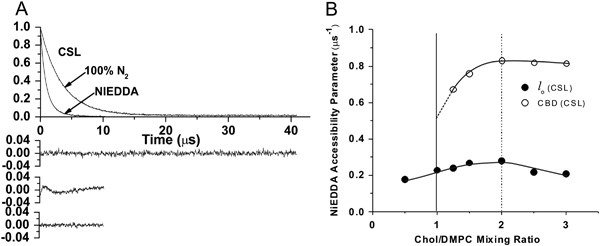
Fig. 4.

a Representative SR EPR signals with fitted curves and residuals (the experimental signal minus the fitted curve) for CSL in Chol/DMPC membranes with a Chol/DMPC mixing ratio of 1.5. Signals were recorded at 27 °C for samples equilibrated with 100% nitrogen. One sample contained 20 mM NiEDDA. The single-exponential fit was satisfactory without the presence water-soluble relaxation agent (NiEDDA) (top residual). In the presence of NiEDDA, the single-exponential fit was not satisfactory (middle residual), while the double-exponential fit was excellent (bottom residual). b The NiEDDA accessibility parameter, calculated on the basis of eqs. (3) and (4) for CSL in the Chol/DMPC membrane is plotted as a function of the Chol/DMPC mixing ratio. The vertical solid line (Chol/DMPC = 1) indicates the Chol saturation threshold, and the vertical broken line (Chol/DMPC = 2) indicates the CST in the DMPC membrane. Figure is reproduced from reference [41], Copyright 2013, with permission from American Chemical Society
