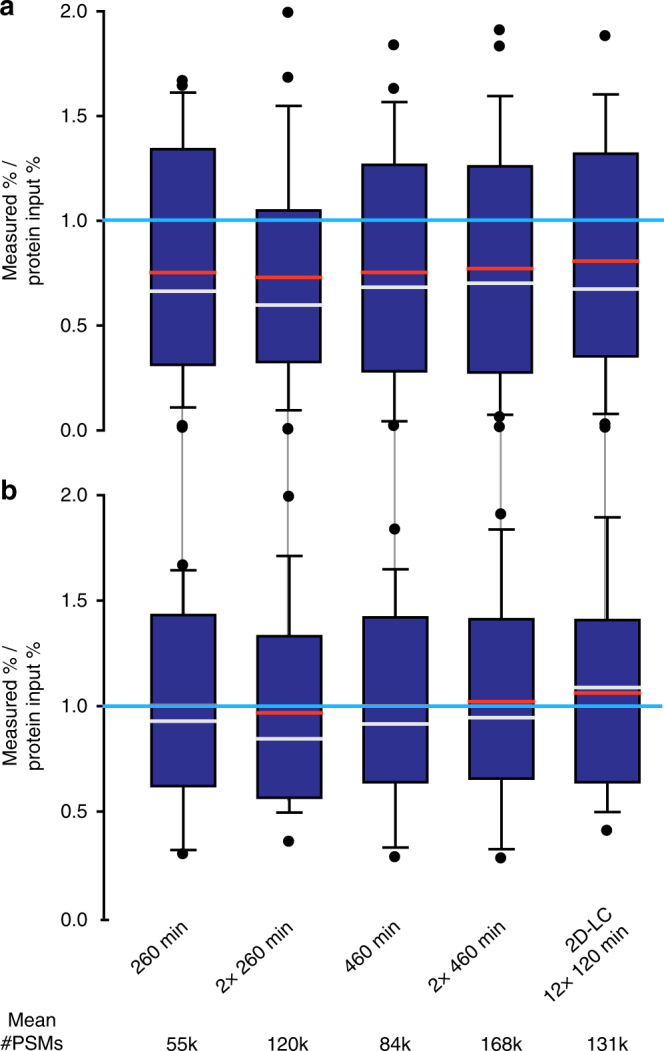
Fig. 5.

Comparison of quantification accuracy for the uneven mock community depending on LC method, gradient length and technical replication. Four biological replicates were run for each method and the number of peptide-spectrum matches (PSMs) was averaged per organism. The numbers below the plots give the average total number of PSMs generated for each of the methods. Box plots show the deviation of the amounts measured by summing of PSMs from the actual protein input amounts. The box indicates the 1st and 3rd quartile, the grey line indicates the median, the red line the average and the whiskers indicate the 10th and 90th percentile. If measurement and input were equal, then all values would be exactly 1 (indicated by bright blue line). The first four methods were 1D-LC-MS/MS runs of the given length. The ‘2×’ indicates if technical replicates were run. The fifth method was 2D-LC-MS/MS runs with each of the 12 fractions measured for 120 min (detailed data for this Figure is in Supplementary Table 6). In a, the deviation values for all 27 detected strains and species are shown. In b, the deviation values are only shown for the 18 strains and species that had an abundance > 0.5% based on at least one of the methods
