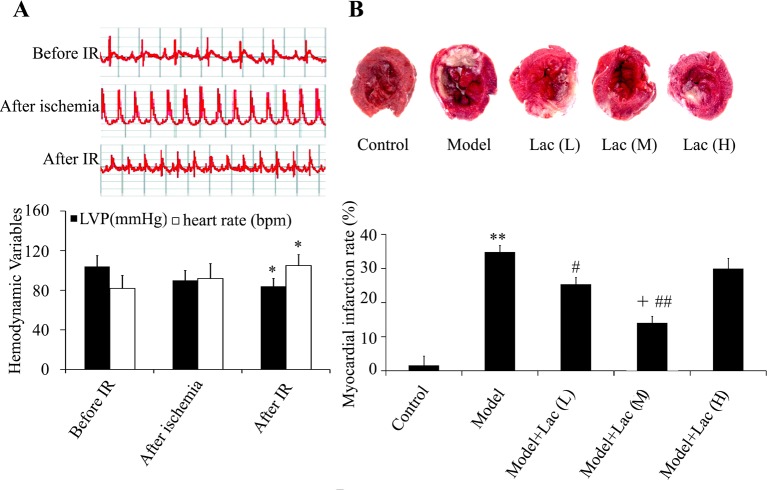
Figure 1. Cardiac function was assayed by ECG machine and TTC staining.
(A) The ECG, LVP, and heart rates were recorded. (B) Myocardial infarction area was identified by TTC staining (n=5). The myocardial infarction area decreased in Lac groups. **P<0.01 compared with control; #P<0.05, and ##P<0.01 compared with model group; +P<0.05 compared with model + Lac (low) group * P<0.05 compared with before IR..

