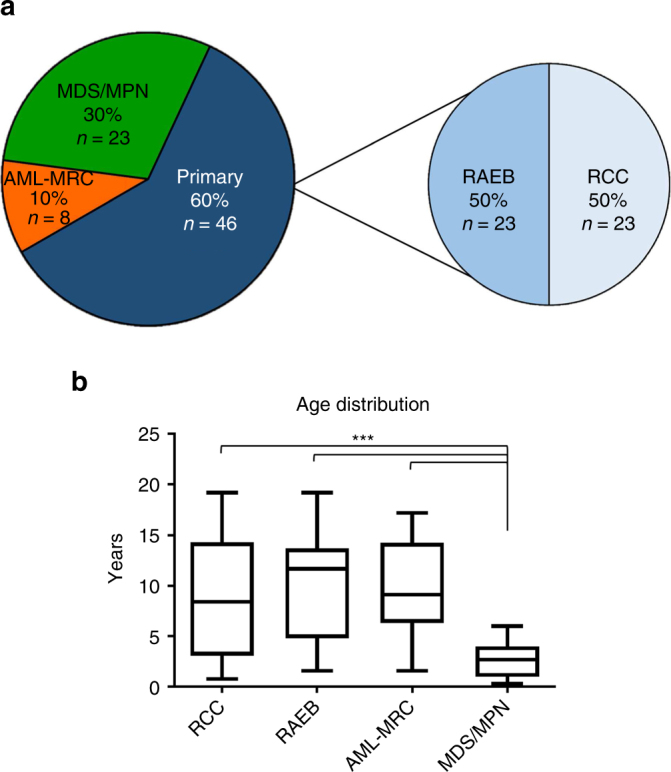
Fig. 1.

Pediatric MDS cohort. a Pie charts depicting the distribution of the three diagnostic categories and subcategories of the pediatric MDS cohort; Total: n = 77. b Distribution of age (in years) at diagnosis for the pediatric MDS cohort. Lines within boxes represent median age (RCC: 8.4, RAEB: 11.7, AML-MRC: 9.1, MDS/MPN: 2.7) and whiskers represent maximum and minimum. ***: p < 0.0001 (student’s t-test). AML-MRC AML with myelodysplasia-related changes, RAEB, Refractory anemia with excess blasts; RCC, Refractory cytopenia of childhood
