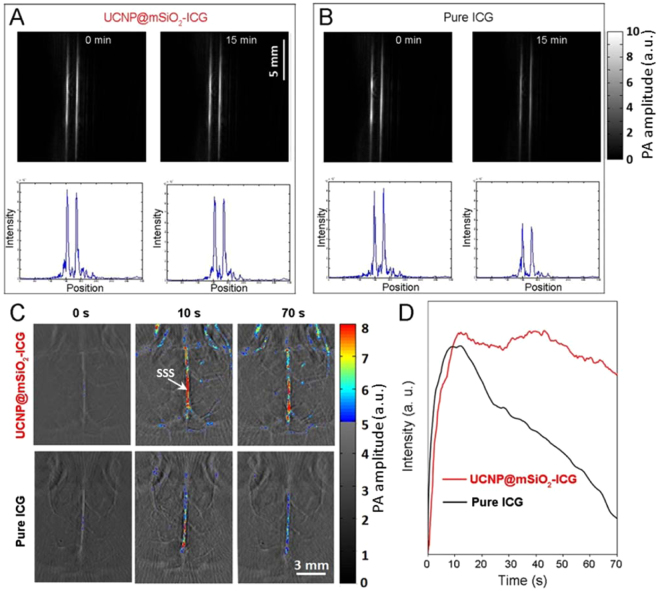
Figure 6.
The photoacoustic imaging and corresponding signal intensity of (A) UCNP@mSiO2-ICG and (B) pure ICG under 800 nm laser with irradiation time at 0 min and 15 min. Note that the absorbance is normalized in 800 nm. (C) Mice brain imaging after injection of UCNP@mSiO2-ICG and pure ICG. The excitation wavelength is 800 nm with pulsed and continuous laer, n=3. SSS, superior sagittal sinus. (D) The in vivo photoacoustic intensity verusus the intravenous injection time.

