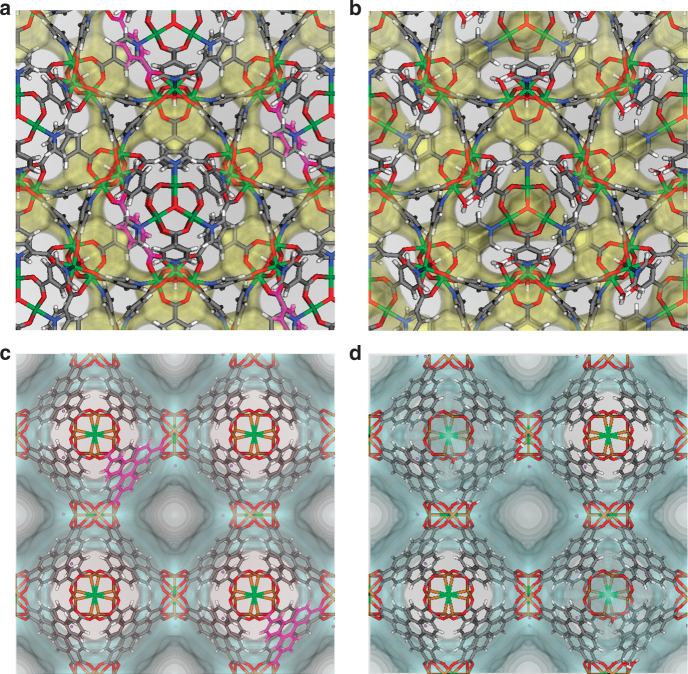
Fig. 8.
Methane energy contours of AXUBOL and REGYOT before and after defect introduction. The yellow contours for a pristine AXUBOL and b defective AXUBOL highlight the methane energy surface with 0 kJ mol−1. The blue contours for c pristine REGYOT and d defective REGYOT highlight the methane energy surface with 0 kJ mol−1. The energy contours were produced for T = 298 K. In a and c, linkers highlighted in magenta correspond to the removal of a single linker from one unit cell. (white: hydrogen, gray: carbon, blue: nitrogen, red: oxygen, dark green: nickel, light green: chlorine, orange: copper, purple: lithium)

