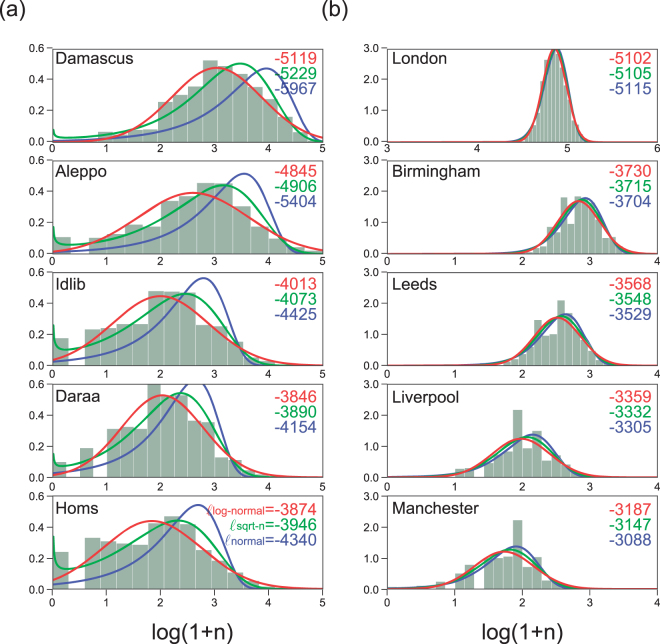
Figure 2.
Distribution of number of deaths per day. (a) Syrian and (b) English cities. Distributions of are plotted. The normal distributions of variables , and fitted to each data are displayed on top of the histograms, with their goodness-of-fit represented in terms of the log-likelihood . The bin-size of the histograms is determined by Scott’s rule that provides the best fitting for a compact set of data, so to minimize the mean square error35.

