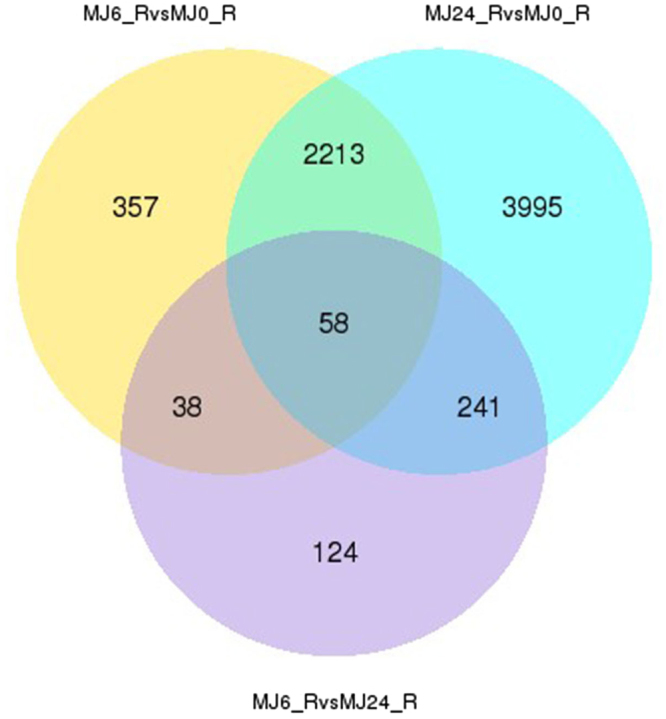
Figure 2.

DEGs comparative statistics. Venn diagram illustrating the shared and unique DEG transcripts from the comparative analysis between different groups (group 1:MJ6-vs-MJ0, group 2: MJ24-vs-MJ0, group 3: MJ6-vs-MJ24); The numbers in each circle indicate the number of DEGs for the corresponding group, and the overlaps indicate the number of shared DEGs between different groups; MJ0, MJ6, and MJ24 indicate the lines treated with MeJA for 0 h, 6 h, and 24 h, respectively.
