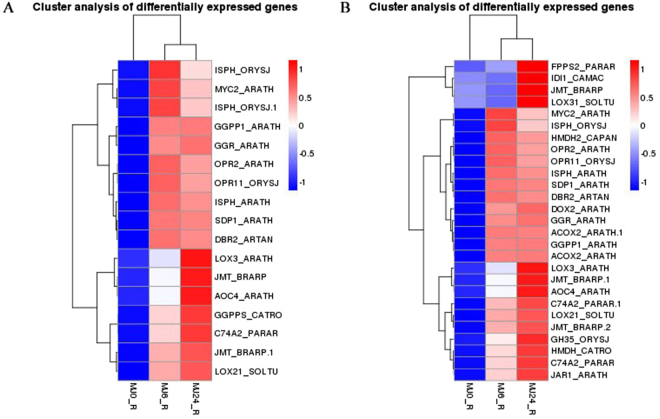
Figure 5.
Heat map of the differentially expressed genes in the α-linolenic acid metabolic pathway and the rubber biosynthesis pathway. MJ0, MJ6, and MJ24 indicate the experiment lines treated by MeJA for 0 h, 6 h and 24 h. The color change from blue to red means the expression level of genes increased gradually. ISPH, 4-hydroxy-3-methylbut-2-en-1-yl diphosphate reductase; transcription factor MYC2; GGPPS (GGPP, GGR), geranylgeranyl diphosphate synthase; OPR (DBR), 12-oxophytodienoic acid reductase; PLA2G (SDP), secretory phospholipase A2; LOX, lipoxygenase; AOC (JMT), allene oxide cyclase; AOS (C74A2), allene oxide synthase; FPPS, farnesyl diphosphate synthase; IDI, isopentenyl-diphosphate delta-isomerase; HMGCR (HMDH), hydroxymethylglutaryl-CoA reductase; DOX, alpha-dioxygenase; ACX (ACOX), acyl-CoA oxidase; JAR1 (GH35), jasmonic acid-amino synthetase.

