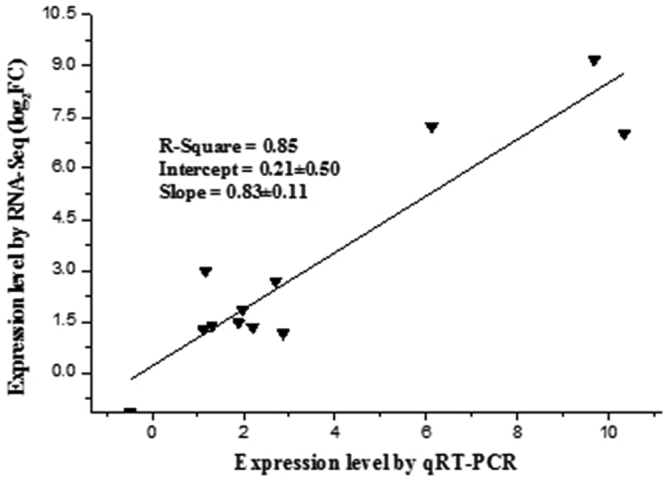
Figure 8.

Correlation analysis of the expression of the 12 selected genes by qPCR assay and RNA-seq. The qPCR values for each gene are represented as means ± standard deviation (SD) of three biological replicates. The selected genes were AOS, hydroperoxide dehydratase; AOC, allene oxide cyclase; LOX, lipoxygenase; OPR, 12-oxophytodienoic acid reductase; HMGCR, hydroxymethylglutaryl-CoA reductase; DXS, 1-deoxy-D-xylulose-5-phosphate synthase; IDI, isopentenyl-diphosphate delta-isomerase; FPPS, farnesyl diphosphate synthase; GGPPS, geranylgeranyl diphosphate synthase; ISPH, 4-hydroxy-3-methylbut-2-en-1-yl diphosphate reductase; transcription factor MYC2; SRPP, small rubber particle protein.
