Figure 9.

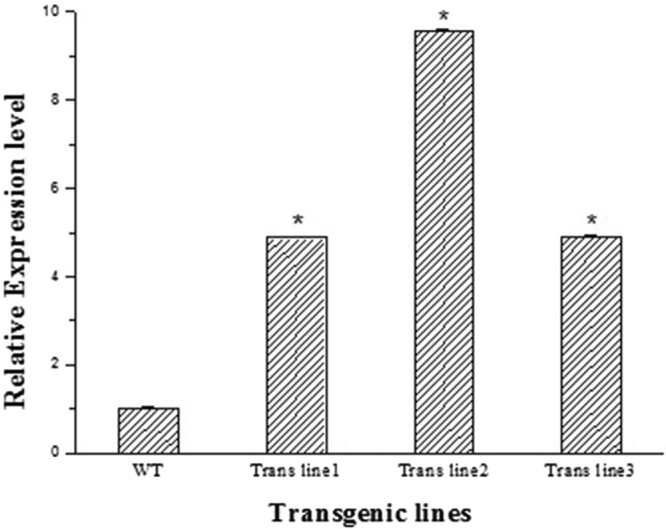
The expression analysis of HMGCR by qPCR in the wild type and DREB transgenic lines. The values represent the mean value ± SE from three replicates. *Indicates significant differences compared to the WT at P < 0.05 (t-test).

The expression analysis of HMGCR by qPCR in the wild type and DREB transgenic lines. The values represent the mean value ± SE from three replicates. *Indicates significant differences compared to the WT at P < 0.05 (t-test).