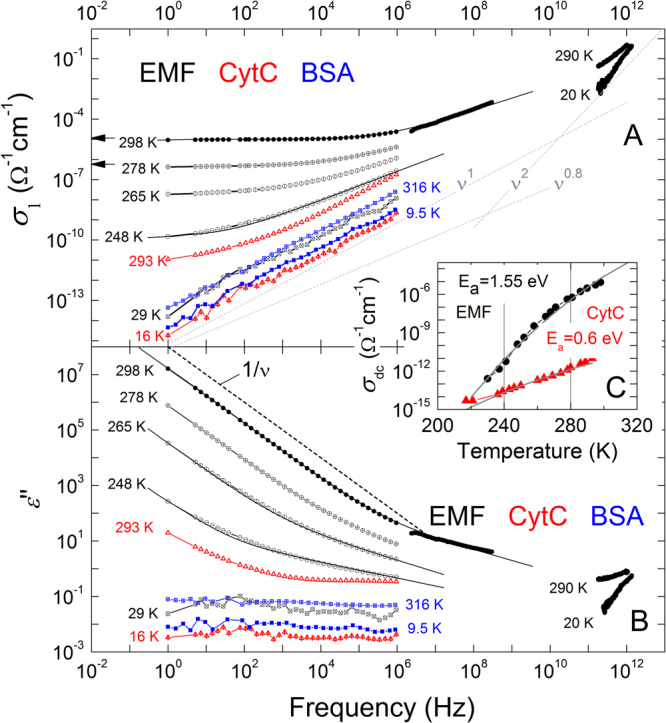
Figure 1.

Broad-band spectra of real part of conductivity (A) and imaginary part of dielectric permittivity (B) of EMF (black circles), CytC (red triangles) and BSA (blue squares) measured at different temperatures. Solid lines represent least-square fitting results based on expression (1) in the text. Dotted lines in frame (A) indicate the σ 1∝ ν1 dependence that corresponds to the nearly constant loss behavior ε″(ν) = const. The σ 1∝ ν 0.8 dependence is typical for hopping transport. Flattening towards low frequencies of the room temperature σ 1(ν) spectra and corresponding increase in the ε″(ν) spectra [ε″(ν) ∝ ν −1 as shown with the dashed line] of CytC are due to finite dc conductivity, as discussed in the text. The ν2 behavior corresponds to the low-frequency “tail” of a Lorentzian-like absorption resonance in the terahertz range (see also Supplementary Fig. 5). The black arrows correspond to dc-measurement of EMF conducted by means of four-probe technique at 278 and 298 K. The inset (C) demonstrates the temperature dependence of the dc conductivity of EMF and CytC samples. Solid lines correspond to activated behaviors as discussed in the text. Water contents in samples according to thermogravimetry measurements: EMF (~30%), CytC (~13%), BSA (~11%).
