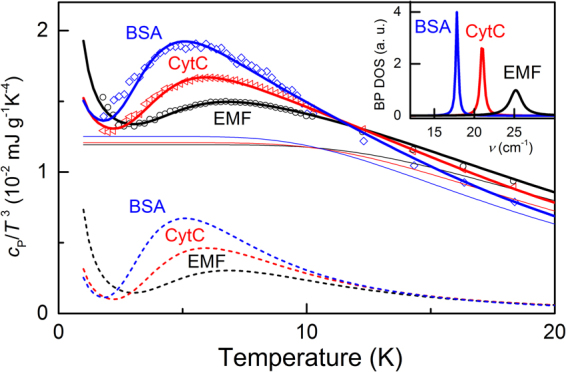
Figure 4.

Dots – low-temperature specific heat of EMF, CytC and BSA, as indicated. Solid lines are fits to the data using expressions (3,4) (see Materials and Methods) with Debye and boson peak contributions shown separately with thin solid and dashed lines, respectively. Inset shows the boson peak density of states for the three samples modeled with Lorentzian lineshapes. Water contents in samples according to thermogravimetry measurements: EMF (~30%), CytC (~13%), BSA (~11%).
