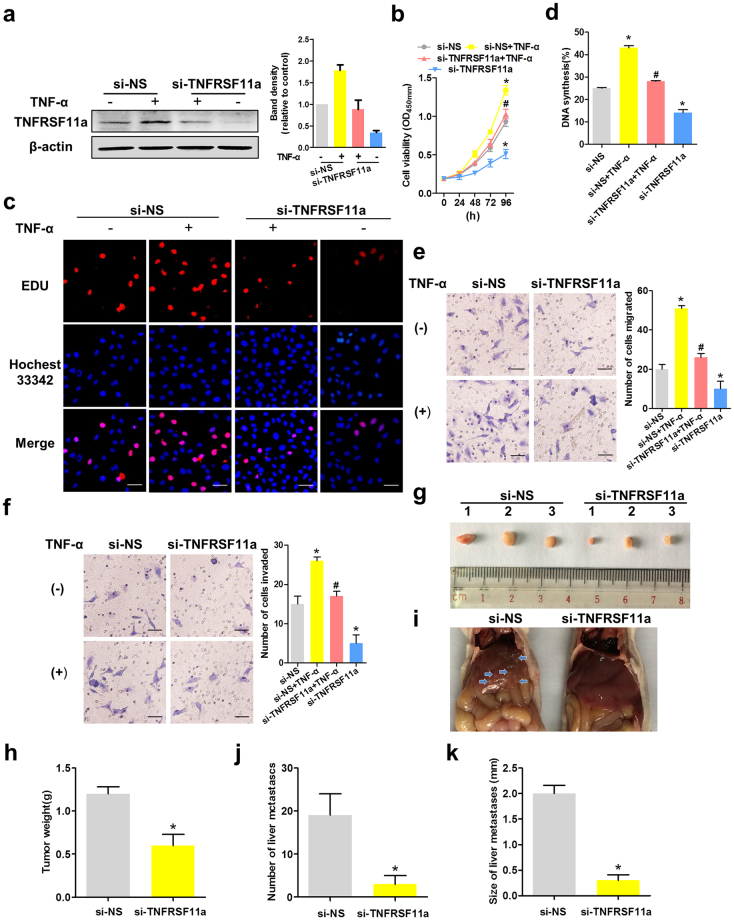
Figure 3.
Tumour necrosis factor (TNF)-α induced TNFRSF11a-mediated cervical cancer cell proliferation, migration and invasion. (a) HeLa cells were transfected with non-specific short interfering RNA (siRNA; si-NS) or TNFRSF11a-specific siRNA (si-TNFRSF11a) for 24 h and subsequently treated or not with TNF-α. TNFRSF11a protein expression was analysed by western blotting. β-actin was used as the loading control. (b) Stable knockdown of TNFRSF11a significantly inhibited HeLa cell growth compared to treatment with si-NS during a 96-h period, as measured by a CCK-8 assay. Data represent the means ± standard errors of the means (SEM; n = 3). *P < 0.05 vs. the si-NS group, #P < 0.05 vs. the TNF-α group. (c) Proliferating HeLa cells were labelled with EdU, which was revealed using the Click-it reaction (red). Cell nuclei were stained with Hoechst 33342 (blue). Representative images are shown. Scale bars = 50 μm. (d) Quantitative results from panel c. Data represent the means ± SEM (n = 3). *P < 0.05 vs. the si-NS group, #P < 0.05 vs. the TNF-α group. TNFRSF11a knockdown altered HeLa cell migration (e) and invasion (f) in Transwell assays. Data represent the means ± SEM (n = 3). *P < 0.05 vs. the si-NS group, #P < 0.05 vs. the TNF-α group. (g) HeLa-si-NS and HeLa-si-TNFRSF11a xenograft tumour masses were harvested on day 28. (h) TNFRSF11a knockdown significantly decreased the xenograft tumour weights, compared with si-NS tumours. *P < 0.05 vs. the si-NS group. (i) Photographs of livers removed from mice in each group. (j) Significantly fewer liver metastases were detected in the si-TNFRSF11a group, compared with the si-NS group. *P < 0.05 vs. the si-NS group. (k) Calculated average sizes of liver metastases removed from the mice in each group. *P < 0.05 vs. the si-NS group.

