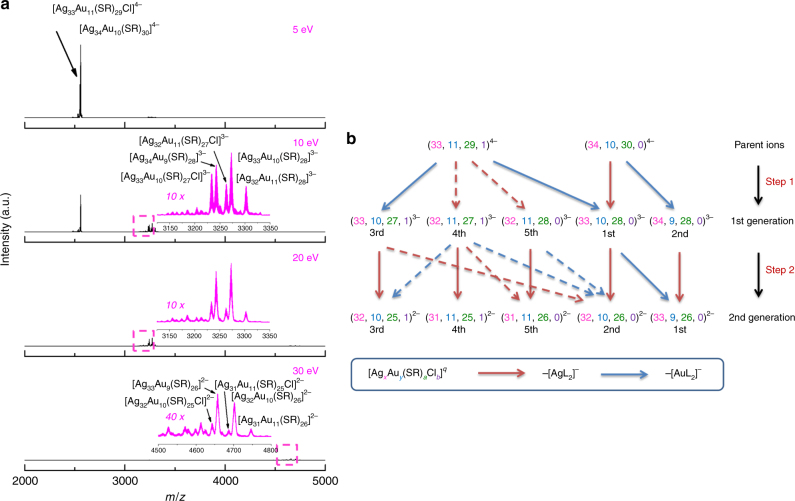
Fig. 3.
Fragmentation habit of Ag@Au nanoclusters. a Tandem mass spectra and b schematic illustration of fragmentation process of Ag-core/Au-shell [Ag34Au10L30]4− and [Ag33Au11L30]4− (marginal) ions (centered at m/z = 2558) obtained at different collision energies. The ligand (L) is thiolate (SR) or halogen (e.g., Cl), and [AgxAuy(SR)aClb]q nanoclusters are referred to as (x, y, a, b)q for simplicity. Insets of a are zoom-in spectra of the boxed area in the corresponding panels. The purple and blue arrows in b indicate fragmentation pathways by dissociation of [AgL2]− and [AuL2]−, respectively; while the solid and dotted arrows show dominant and minor fragmentation pathways, respectively. The abundance sequence of each fragment cluster ion is indicated underneath in b

