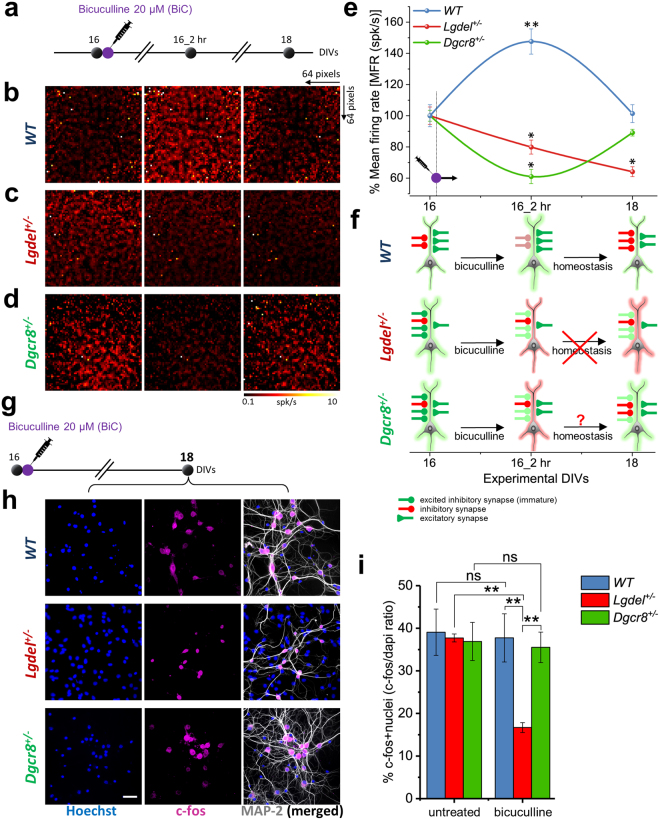
Figure 4.
Electrical and optical evidence of dysregulated network homeostatic plasticity in Lgdel +/− and Dgcr8 +/− networks. (a) Schematic illustration of the experimental protocol used to test network homeostatic plasticity responses upon 20 µM bicuculline-treatment. (b) Snapshots showing the homogenous averaged MFR maps (64 × 64 electrode pixels) for a WT network at the different experimental time points and each map is computed for a recording of 10 minutes. (c) As in (b), but for a Lgdel +/− network. At 16 DIVs the network manifests an already higher averaged MFR than WT. Upon bicuculline-treatment the maps at 16_2 hr and 18 DIVs indicate a decrease of the network firing activity without the homeostatic restoration to the initial condition. (d) As in (b) and (c), but for a Dgcr8 +/− network. (e) Quantification of the MFR shows after bicuculline-treatment (16_2 hr), a significantly decrease in Lgdel +/− and Dgcr8 +/− networks, and a significantly increase in WT from the initial baseline (**p < 0.01 WT, *p < 0.05 Lgdel +/−, *p < 0.05 Dgcr8 +/−, ANOVA; n = 5). At 18 DIVs, the MFR continuously decreases in Lgdel +/− networks, while it returns to the baseline value in Dgcr8 +/− networks and sets to a nearly similar MFR of WT. (f) Cartoon illustrates the homeostatic regulation of the excitation-inhibition balance in WT, Lgdel +/− and Dgcr8 +/− neurons at the different time points. (g) Schematic of the experimental protocol used to assay the cellular neuronal activity with c-fos immunofluorescence after 48 hr from bicuculline-treatment. (h) Fluorescence micrographs showing the c-fos expression 48 hr after bicuculline-treatment in WT, Lgdel +/− and Dgcr8 +/− networks and confirming previous electrical read-outs. (i) Quantification of c-fos-positive nuclei ratio 48 hr after bicuculline-treatment. Data showing a significant decrease in expression in Lgdel +/− neurons compared to WT, and Dgcr8 +/− neurons (**p < 0.01, ANOVA; n = 5), as well as compared to the expression in Lgdel +/− neurons before bicuculline-treatment (untreated) (**p < 0.01, ANOVA, n = 5).

