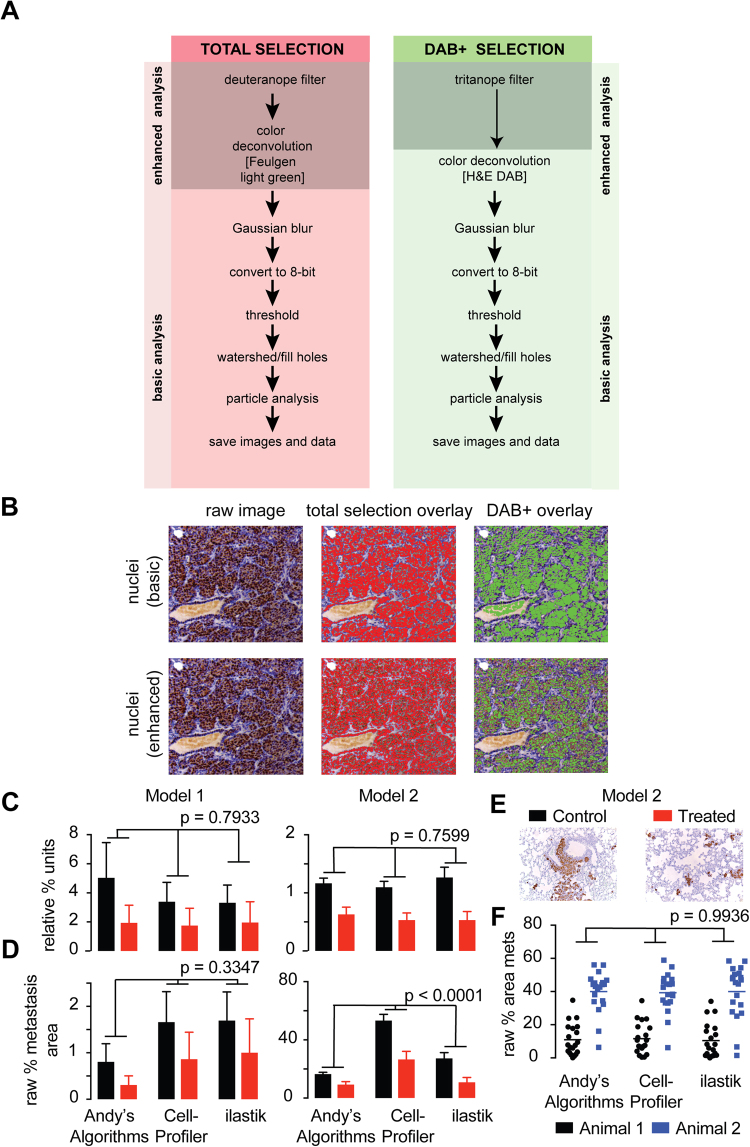
Figure 1.
A new pipeline for image quantification of DAB+ IHC. (A) Flow chart depicting the image processing steps within the DAB+ algorithm for the selection of all (hematoxylin and DAB+) and positive cells (DAB+ only). The basic algorithm is used when there is appropriate discrimination between blues and browns in any given IHC image, and the enhanced algorithm should be used when poor discrimination between blues and browns is apparent (B) Representative IHC images (left panels) showing poor discrimination between blues and browns and the selection overlays for total cells (middle panels) and DAB+ cells (right panels) for both the basic and enhanced DAB+ algorithm. Bar graphs depicting the normalized (C) and raw (D) metastatic area calculated by Andy’s DAB+ algorithm and compared to CellProfiler and ilastik of metastatic area of the lungs of mice bearing xenografts from two different breast cancer models22. An average measurement from 3 mice was calculated from the average of 10 images is depicted. Representative DAB+ IHC images used in the analysis in C and D is shown in (E). (F) Bar graphs depicting the calculated raw metastatic area in individual images (20 per mouse) in the lungs of two mice (blue and black) corrected for uneven illumination and white background calculated with Andy’s DAB+ algorithm and compared to CellProfiler and ilastik using data from22. ANOVA p-value tests variance across algorithms.

